

Dubai Municipality — AI Park Design Challenge
AI Methodology Report
Tools, workflows, alternatives considered, and how AI contributed to every design decision for the Al Safa 2 neighbourhood park.
Al Safa Park 2 · Lamma
Dubai Municipality AI Park Design Challenge · Deliverable
Directly addresses the 20% “Effectiveness of AI Integration” criterion: every figure traces to a script in the repository and to a design decision.
01 — Framing
AI as an instrument of the design process
The brief rewards artificial intelligence used through the design process — research, analysis, ideation, scenario testing, visualisation and decision-making. Every figure in this report was produced by a computational or AI workflow and is traced to a specific design decision.
“A park people already love for eight months of the year, and avoid for four: the evidence points to where shade, cooling and access can change that.”
That is the claim about the park. The claim about the method is simpler, and it is the one this report is scored on: an open, local, verifiable pipeline in which AI is competent everywhere it is asked to act, with closed tools only at the edge. The rest of this section says what that means and why it was chosen.
Open at the core, proprietary only at the edge
Everything under this report runs on open data and open-source software. The data: Landsat,
ERA5-Land and Sentinel-2 (open archives, fetched through Earth Engine), OpenStreetMap, the
Meta/WRI canopy model, iNaturalist, public reviews. The software: thermofeel, SOLWEIG, OSMnx, SciPy,
OpenFOAM, i-Tree coefficients; LibreDWG, three.js, Blender and its MCP add-on, ComfyUI and ControlNet,
IfcOpenShell, pandoc, the agmsg bus. The AI models are the exception — hosted, closed,
paid per call (Claude, FLUX, MiniMax, Seedance) — and are treated as such below.
This was a method decision, not a licensing preference, for three reasons. Accessible: anyone with the repository can re-run every number in this report; nothing depends on a seat licence or a vendor account. AI-legible: the models are far more competent with open tools than closed ones, because the documentation and the source are public — an agent can read the SOLWEIG code, run it, see the error and fix the call, where a proprietary desktop tool behind a cloud login is a black box it can only describe. The open stack is where AI agents are competent; the closed stack is where they guess. Local context: the models are stateless, but the project is not. Every dataset, script, intermediate result, correction and rejected alternative lives on the local drive under version control, so the full context of the work belongs to the team — readable by any agent, any teammate and any future project — instead of being scattered across cloud tools’ histories. The AI is called; the knowledge stays. Put another way: the model is rented and will be replaced; the context and the harness are owned and compound, so every model release is a free upgrade to a workforce the team already has. Built for churn: the models, tools and hosted services at the edge arrive and disappear in weeks — in this project alone a video model released on 31 July was in production use by mid-August, five models were compared and three retired within a fortnight, and the published price was wrong on every check. A method built on any of them would date before submission, so the method is built for substitution instead: the seam to the model is kept thin (a conditioning image rendered from our own scene, a camera path, a prompt — things any successor accepts, §08), every run records endpoint, version and measured cost so a swap is auditable, a deterministic no-AI baseline remains the permanent fallback, and model choice is a dated decision with a stopping rule, not a commitment.
One rule follows from all of this and is worth stating on its own, because it decides where the computation happens: agents decide what to run; open, deterministic code computes. Judgement, framing and reading a vague request live in the model; arithmetic, geometry, network analysis and simulation live in scripts. No number in this report was produced by a language model.
Proprietary tools were still used, because teammates and the profession use them — AutoCAD for the design drawing, Revit for the BIM handoff, Illustrator for the map finish. The rule was to keep them at the edge, fed by conversion, never at the centre. The DWG enters through a local LibreDWG / vector-PDF extraction; one Python model then feeds the web viewer, the Blender scenes and an IFC4 export that Revit opens with every assumed height carried in as a property (§07); the city map is written as a layer-tagged SVG so it ungroups cleanly in Illustrator; sections and schedules export as true-scale PDFs. Nothing comes back into the core from a proprietary tool by hand: the drawing is the input, and the open pipeline is the record of everything done to it.
“Process” came to mean more than analysis
This report was first framed when the work was mostly measurement — heat, shade, comfort, access. By submission the same operating model had been used in five distinct modes, each with its own section: to analyse (the remote-sensing, comfort and network pipelines, §05); to orchestrate (a team of role-bound agents on a message bus, and a bot mailbox so teammates without that setup could still task them, §03); to model (one drawing digitised into a single correctable 3D source that feeds viewer, Blender and IFC, §07); to generate (photoreal stills and film that cannot move the geometry they are conditioned on, §08); and to operate (a live Blender session driven by an agent, by voice, §07). What stayed human in every mode: the choice of every design move, every dimension, every go/no-go, every send.
Two commitments run through all five. First, verification over assertion: independent models are made to check each other, and predictions are tested against field measurement before they inform design. Second, honesty about transfer: almost every published cooling precedent is from a milder, wetter climate, so borrowed numbers are treated as methods that transfer, not results that replicate. A rigorously verified hot-arid Gulf application is itself the novelty of this entry. And one limit, set by the community reading in §05: heat is what the tools could measure best, not the only thing the park is for — the reviews say what people already love about it, and the analysis is held to not breaking that.
02 — Foundations
Knowledge base: the R&D process behind the method
None of this started from a blank page. The pipeline is assembled from four standing knowledge sources — which is what lets a small team run an evidence-grade, cross-validated analysis at pocket-park scale rather than improvising each step.
plateau agent.Treating prior coursework, past entries and PLATEAU as a reusable knowledge base is the R&D method: each new project inherits a tested pipeline and improves it, rather than starting over — which is why the Al Safa 2 stack is method-compatible with Al Karama and the PLATEAU use-cases by design.
03 — Workflow
How the work was actually run
The analysis was not a series of one-off prompts. It was executed as an orchestrated multi-agent process: a named team of role-specialised AI agents (built on Claude Code), each bound to a subdirectory of the project and coordinating through a shared message bus (agmsg). The division of labour is visible in the repository’s own folder structure.
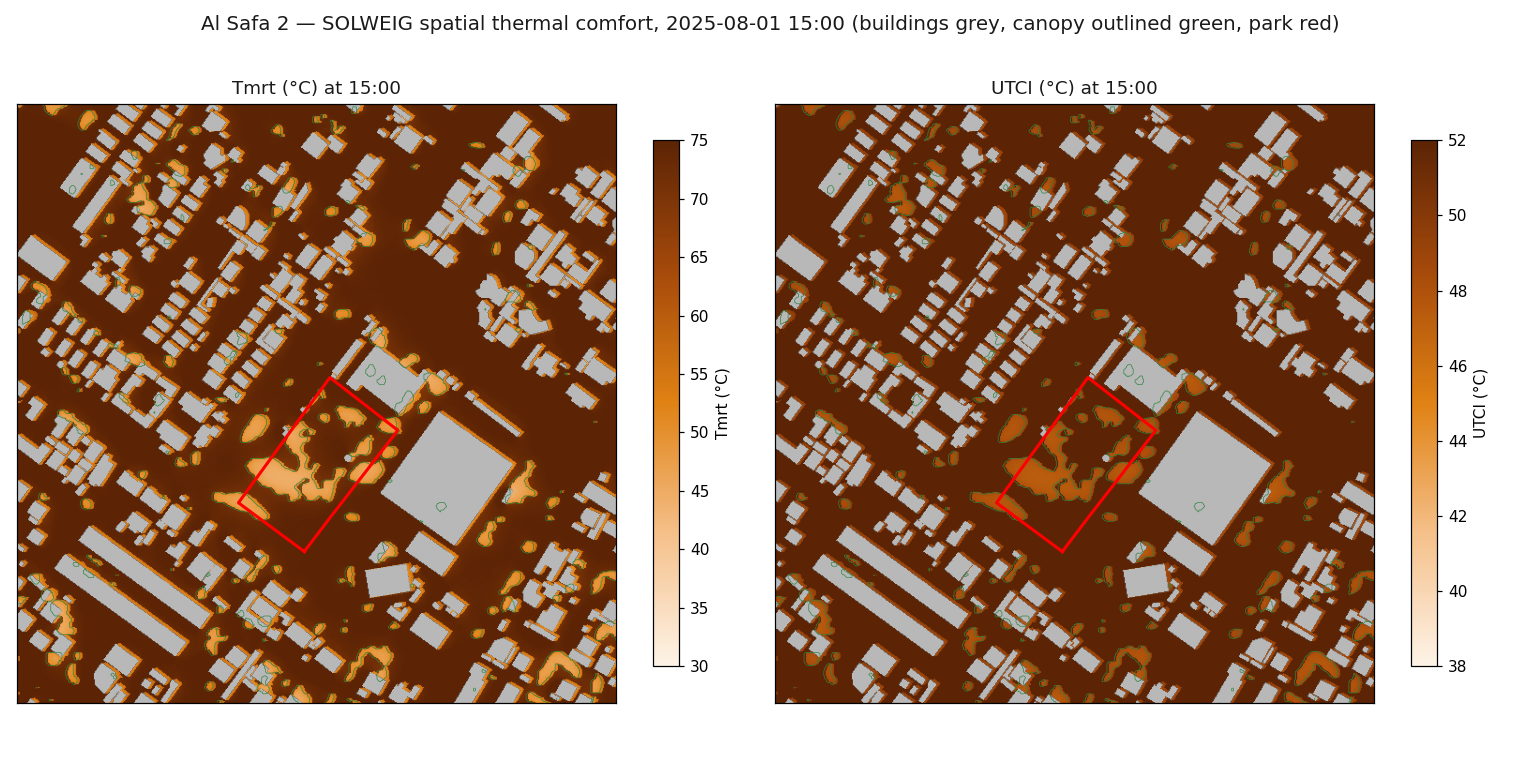
The work was split across agents for three reasons: to advance the many independent technical domains in parallel; to keep each agent in a bounded, expert context — its own subdirectory, data and environment (the SOLWEIG agent needs the GDAL/PythonGIS stack, the FLIR agent the thermal-extraction toolchain); and to bridge cleanly to our separate PLATEAU / CFD project over the shared bus. A fourth benefit emerged unplanned: independent pipelines cross-checking one another — the SOLWEIG and ERA5 + thermofeel peaks agreeing at 52.6 °C is two agents’ work converging on the same answer.
Each Claude Code session auto-joins the bus, so tasks, findings and corrections are passed between specialised agents rather than held in one context.

Reaching the agents from outside the bus — a bot mailbox
The bus above is internal: it joins the Claude Code sessions on one machine, and a teammate
without that setup cannot post to it. So the team was given a plainer door. A dedicated Gmail account
(Maquito, the project’s bot identity — the same account that owns the site deployment) was
connected to Claude Code through the Gmail connector, and teammates simply e-mail it. The first real
use was the city-context map: on 13 August Jiin’s brief — “a 3–5 km radius,
more restrained, OpenStreetMap vector data not a screenshot, and a second much smaller neighbourhood
map” — was forwarded to the mailbox; the agent read it, built the OSM fetch and render
scripts in citymap/ (5/10/15-minute walking isochrones on the real pedestrian network in
place of distance rings, a quiet black-and-white palette with the park as the only orange), and drafted
the reply with the maps attached. Jiin’s comments came back by mail the same afternoon —
no wording, no boundary dots, too pale — and were turned round the same way. A second
thread carried the height-schedule review.
The interesting part is the guard-rail, because an inbox that an agent acts on is an obvious injection surface: anyone can write to it, and a message can carry instructions. So the mailbox was run draft-only, human-gated in both directions. Mail reached the agent because a human forwarded it, and nothing left without a human opening the draft, attaching the files and pressing Send — the connector cannot send, only draft, and that limitation was kept as the rule. The ledger for the two days it ran is small and honest: 2 inbound mails read, 3 drafts, and about 10 human interventions across them — design corrections relayed from Jiin, “say it’s from Maquito, not Makoto”, and twice “the draft is too long”. That ratio is the point: the agent did the fetching, mapping and writing; every judgement and every send stayed with a person.
Every finding in this report is a versioned Python script that prints its own sanity statistics — the full, reproducible source is the project repository. Competition CAD is converted locally (never uploaded to online converters) to respect the Schedule 6 IP terms.
04 — Tools
The instruments
The stack is entirely open-source or peer-reviewed, which makes every claim auditable. It is grouped below by what each thing is — the data we drew on, the hardware we took to the site, the models that did the analysis, the tools that communicated it, and the agents that ran the process. The generative and simulation tools in the roadmap (§10) extend it. Every entry links to its source.
Data sources & platforms
| Source | What we take from it |
|---|---|
| Google Earth Engine | Cloud platform running all remote-sensing composites |
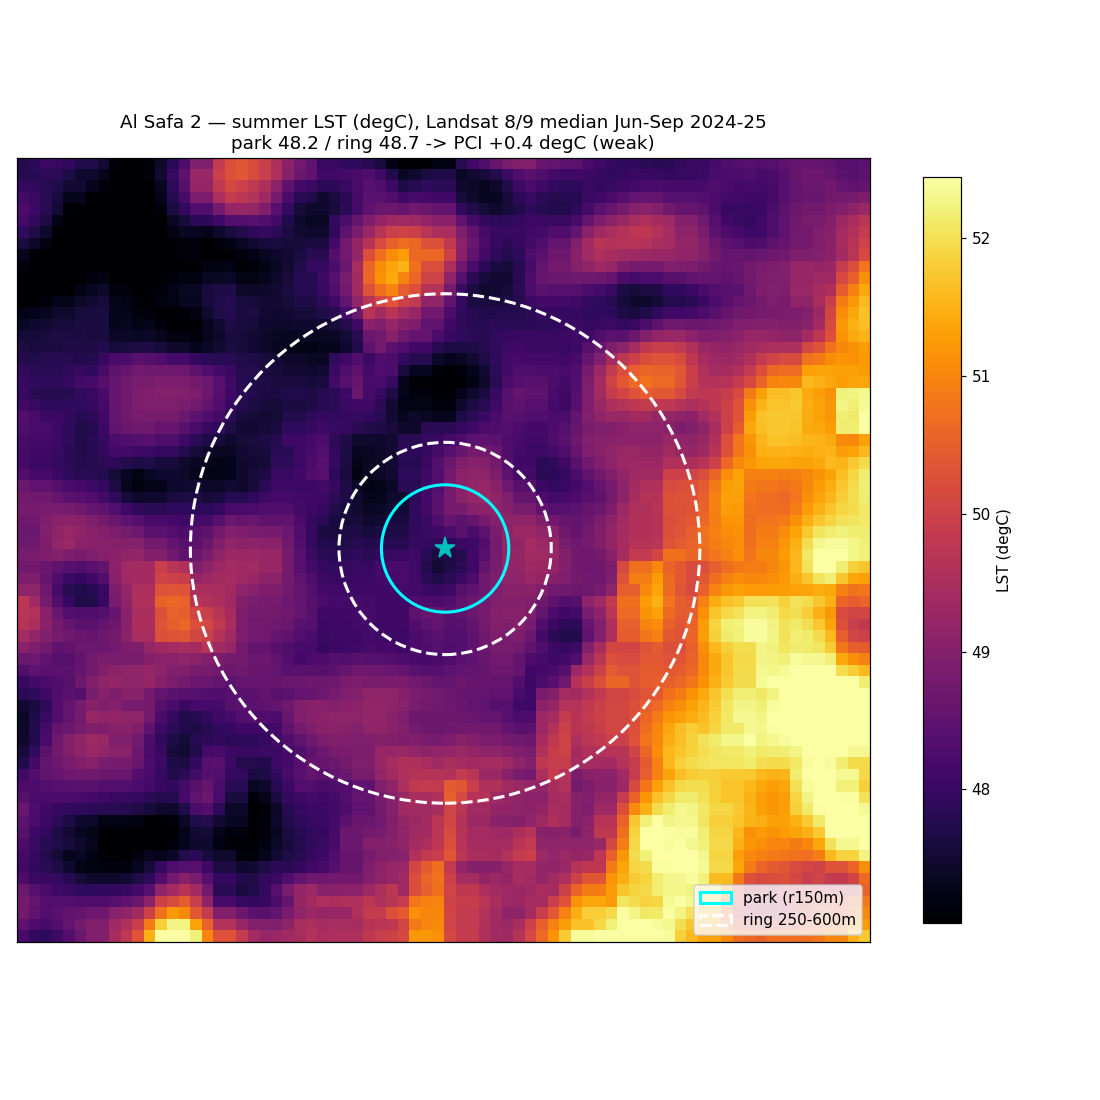
| Landsat 8/9 | Summer surface temperature; 1972–2025 development timelapse |
| ERA5-Land | 10-year hourly air temperature, humidity, wind, radiation |
| Sentinel-2 | 10 m greenery (NDVI) & recent change maps |
| Meta / WRI 1 m canopy height | Tree geometry — 214 canopy patches |
| OpenStreetMap | Building footprints, pedestrian network, POI |
| iNaturalist | Ground-truth tree species observations |
| Mapillary (Graph API) | Street-level ground-truth imagery — playground equipment & furniture inventory |
| Dubai statistics (DDSE) · Dubai Pulse | Official population; community-boundary polygon |
| Google Maps reviews (via Outscraper) | The park’s complete review corpus — 1,152 reviews 2013–2026, exact timestamps, texts, reviewer-uploaded photos → personas & behavioural seasonality |
Field-capture hardware
| Device | What it captured |
|---|---|
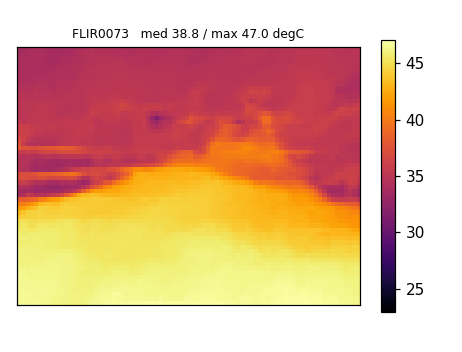
| FLIR C3 thermal camera | Ground-truth surface temperatures to validate the shade model |
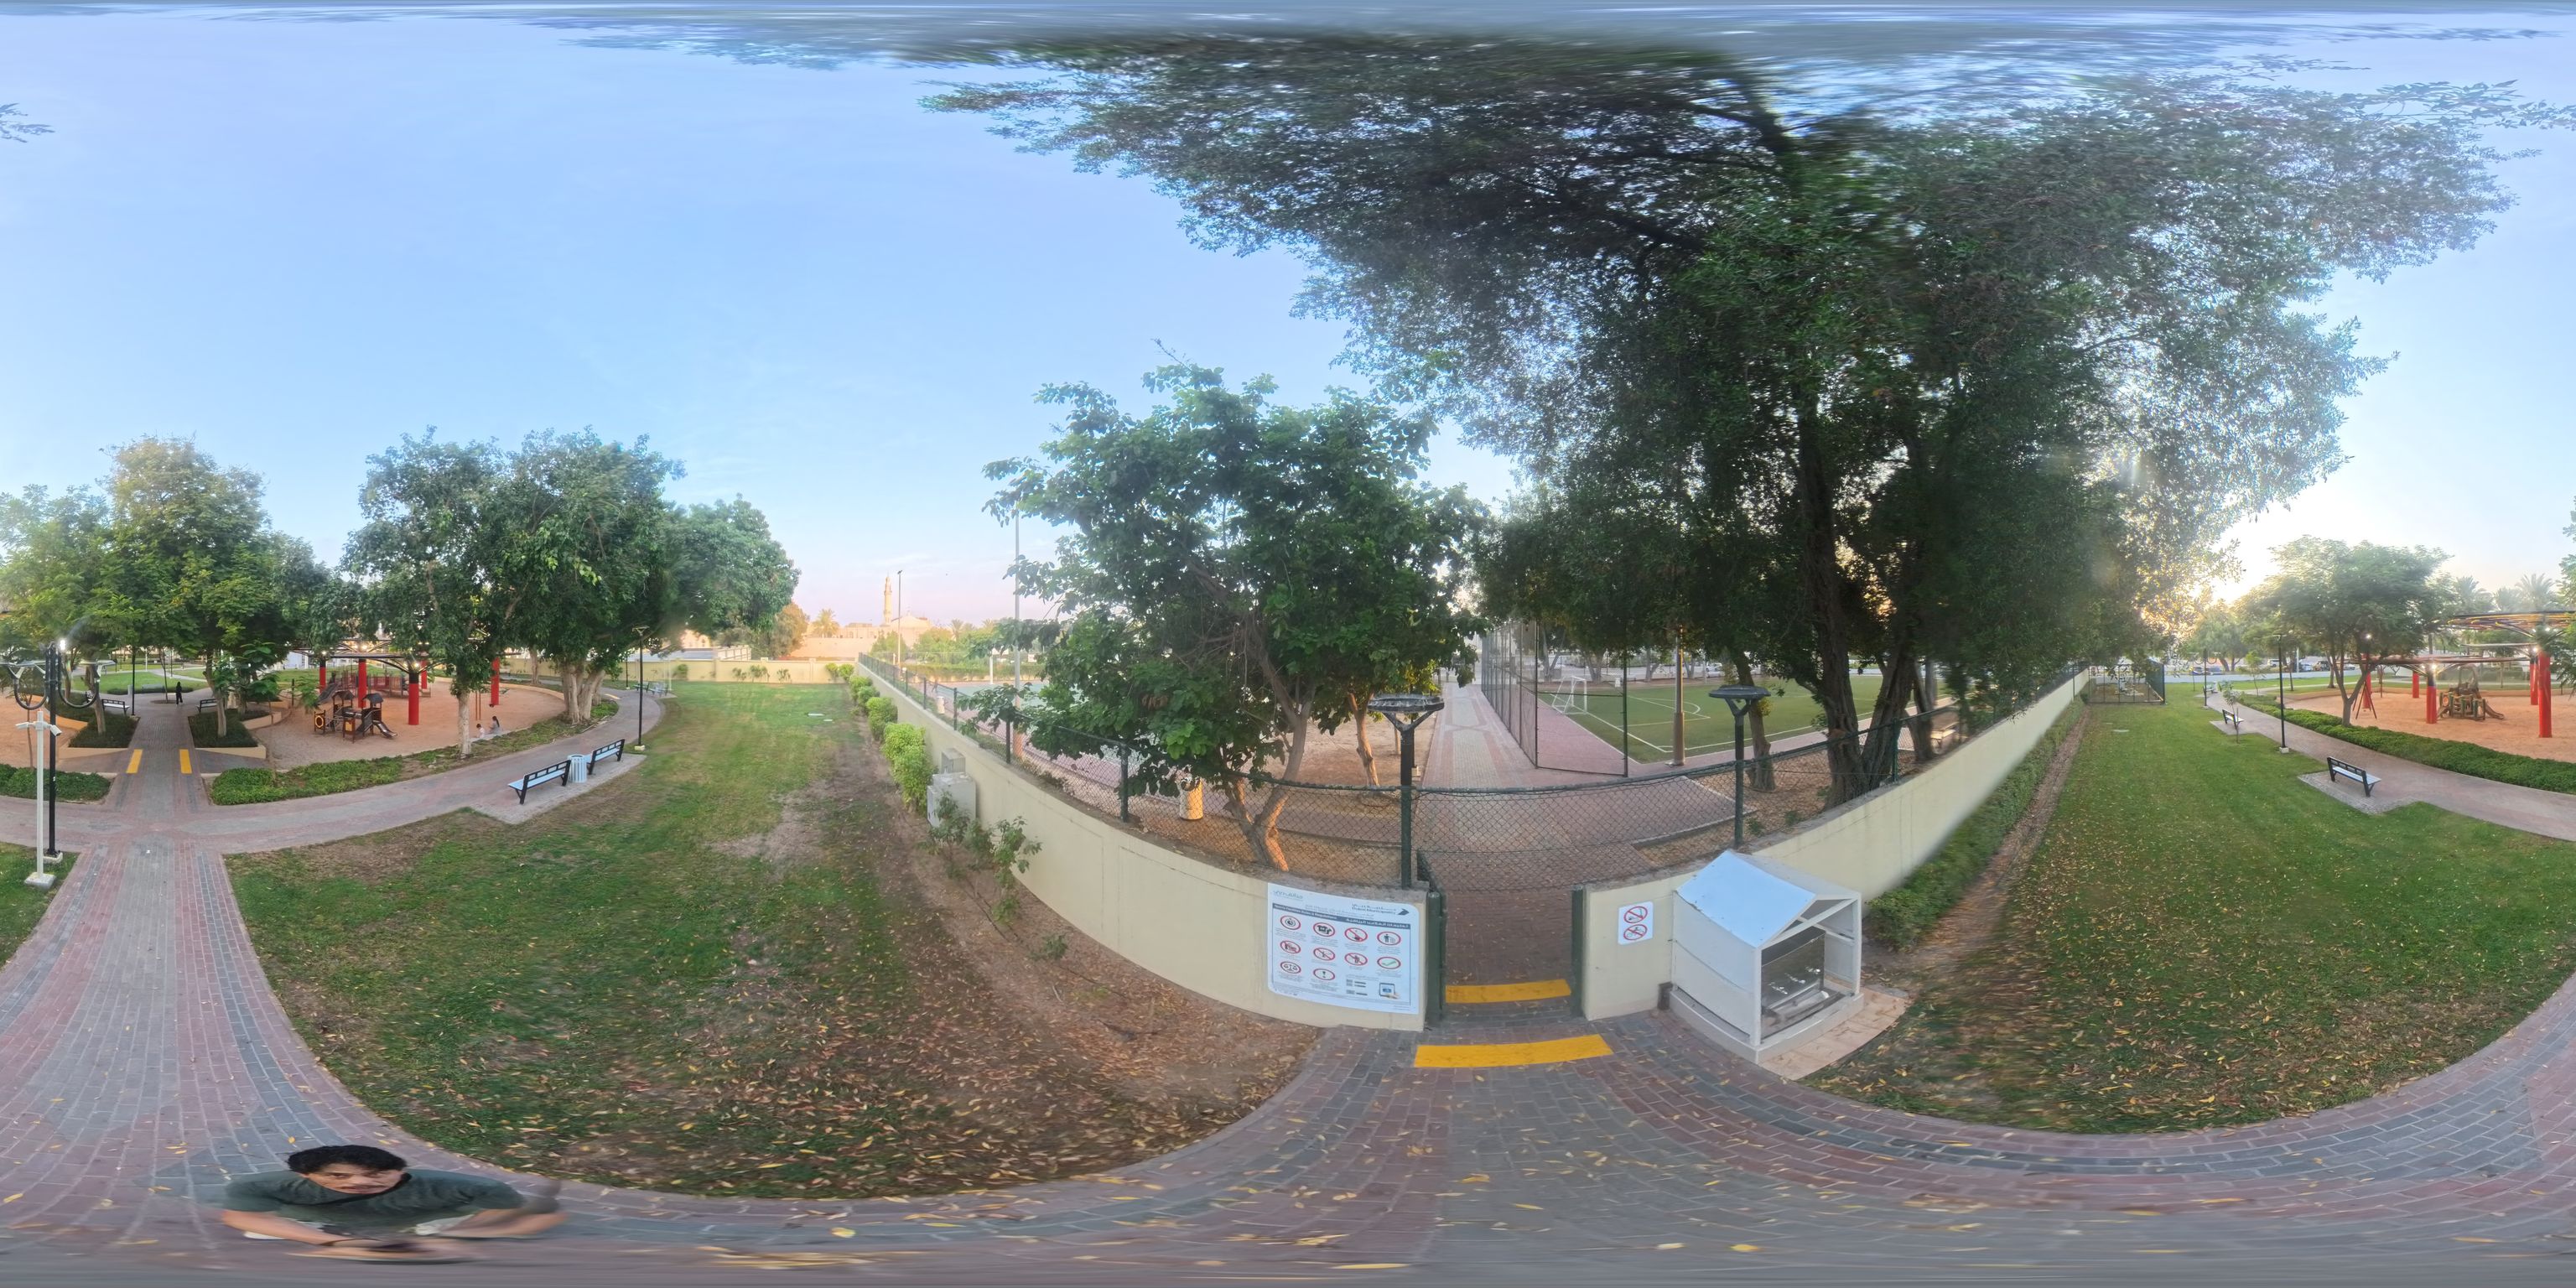
| Insta360 X3/X4 360° camera | Panoramas + walk video for the 3D viewer & photogrammetry |
| iPhone (GPS companion) | Geotagged photos; time-anchor for the FLIR track |
Physical-prototype hardware (Tree-gochi demonstrator)
| Tool / component | Role in the process |
|---|---|
| LILYGO T-Display S3 AMOLED (ESP32-S3) | Physical tree-gochi demonstrator — commodity dev board (~$25) |
| MicroPython + RM67162 community driver | On-device dashboard on the QSPI AMOLED — open-source firmware, vetted & flashed locally |
esptool / mpremote + in-house safe_cp.py | Flash & sha256-verified chunked deploy over a faulty USB-CDC link |
| USB-tethered bridge server + three.js viewer link | Live browser twin of the screen; thirsty-Ghaf click-through in the 3D viewer (agent-to-agent build) |
Analysis & simulation
| Tool | Role in the process |
|---|---|
| thermofeel (ECMWF) | Universal Thermal Climate Index & mean radiant temperature (Di Napoli et al. 2020) |
| SOLWEIG (solweig-gpu, GPLv3) | 1 m spatial comfort maps & the intervention matrix |
| In-house vector shadow engine | Hourly ground shade on the design day (in this repository) |
| OSMnx / NetworkX | Walkshed, betweenness, isochrones, heat-dose routing |
| scipy (csgraph, ndimage) | Shade-seeking pedestrian ABM; water-feature siting overlay |
| OpenFOAM | Wind / porous-edge CFD |
| i-Tree coefficients | Tree ecosystem-service ledger (US Forest Service) |
| COLMAP / Brush | Photogrammetry & Gaussian-splat reconstruction |
Visualisation & delivery
| Tool | Role in the process |
|---|---|
| deck.gl | Interactive 3D park explorer |
| trimesh (glTF/GLB) → three.js | Faithful geometry model (buildings, walls, café, playgrounds, furniture) in a browser viewer lit by the real design-day sun with cast shadows; built & refined against site photos, 360s and Mapillary |
| pannellum | In-map 360° street-view |
| Pandoc → Beamer / XeLaTeX | Slide deck & PDF build |
| Cloudflare Pages | Password-gated static delivery of the findings site |
AI orchestration & workflow
These are the harness and skills that ran the analysis, distinct from the open-source models above. Unlike those, this layer is not all open-source — the availability column says what each one is, so no openness is implied that isn’t there.
| Tool / skill | Role in the process | Availability |
|---|---|---|
| Claude Code | The agent harness the whole team runs on | Proprietary (Anthropic) · docs linked |
| agmsg | Inter-agent message bus (see §3) | Open source · github.com/fujibee/agmsg |
| deep-research skill | Five-angle fan-out search + adversarial 3-vote verification — produced the technology scan (§10) | Bundled Claude Code skill |
| dataviz skill | Design system used to build this report’s charts | Bundled Claude Code skill |
Of this layer, agmsg is open-source (github.com/fujibee/agmsg); Claude Code is proprietary, and deep-research / dataviz are bundled Claude Code skills. Every analysis and visualisation library in the tables above is open-source under a recognised licence — e.g. OSMnx (MIT), thermofeel (Apache-2.0), SOLWEIG / OpenFOAM (GPL), deck.gl / pannellum (MIT) — each linked to its project home.
05 — Coverage
Eight AI-use areas, and the decision each produced
The brief names eight areas where AI use is expected. Each was addressed as question → method → finding → decision.
Community voice: the park’s complete review corpus, mined (area 2)
Question. Field visits and official statistics describe the park’s population, but not its relationships — who uses it, what they defend, and what drives them away. No resident survey existed. Could thirteen years of public Google reviews substitute for one?
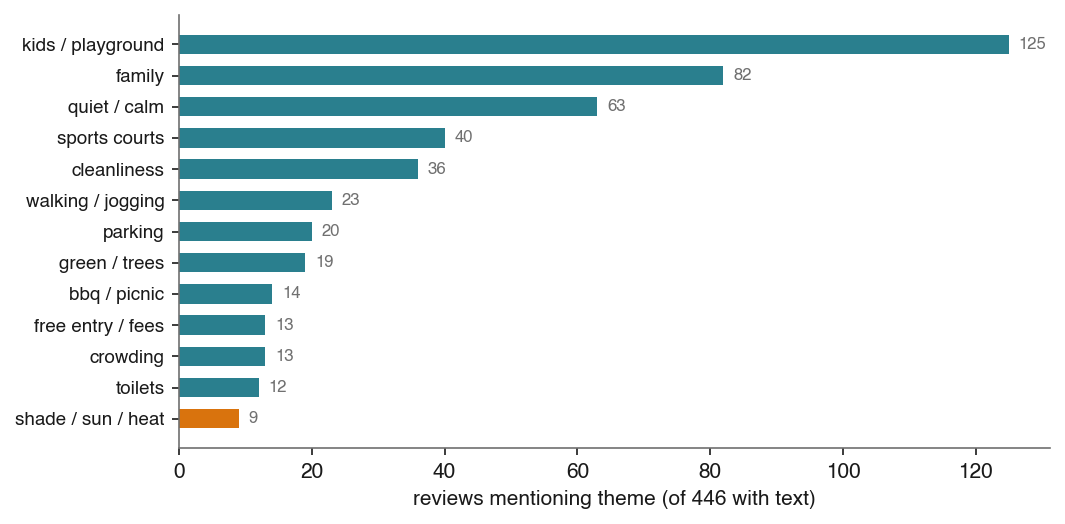
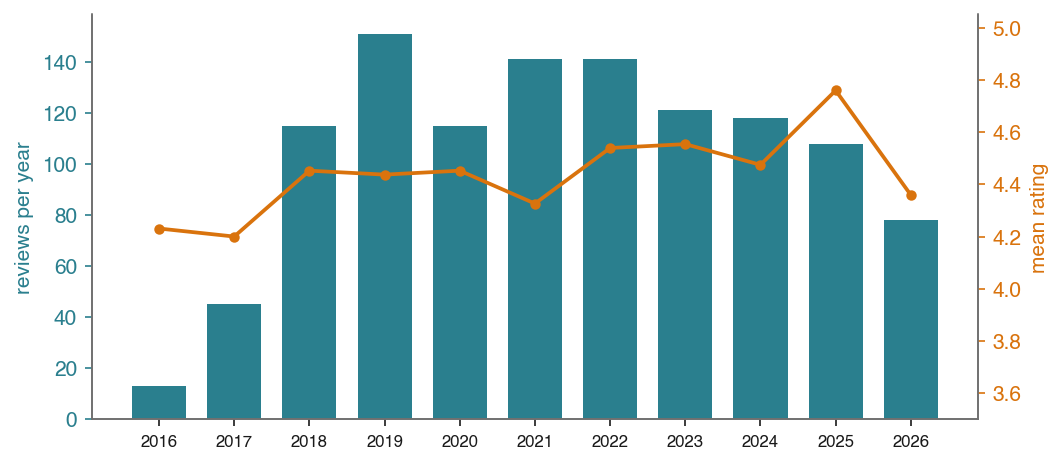
AI method. The listing’s place ID was derived by decoding the feature ID embedded in its share link; all 1,152 reviews (2013-01 → 2026-08, exact timestamps) were retrieved via Outscraper on 2026-08-13. An LLM close-read of the 446 written texts (413 Latin-script, 32 Arabic — read in the original) produced theme counts, six personas each anchored to named reviews, and two verification passes the raw star average hides: a behavioural seasonality curve, and the 2026 complaint cluster. The reviewers’ 55 uploaded photos were classified as evidence of night use, events, and the Municipality’s own consultation posters. Reproducible from; full write-up with personas, quotes and photos in /.
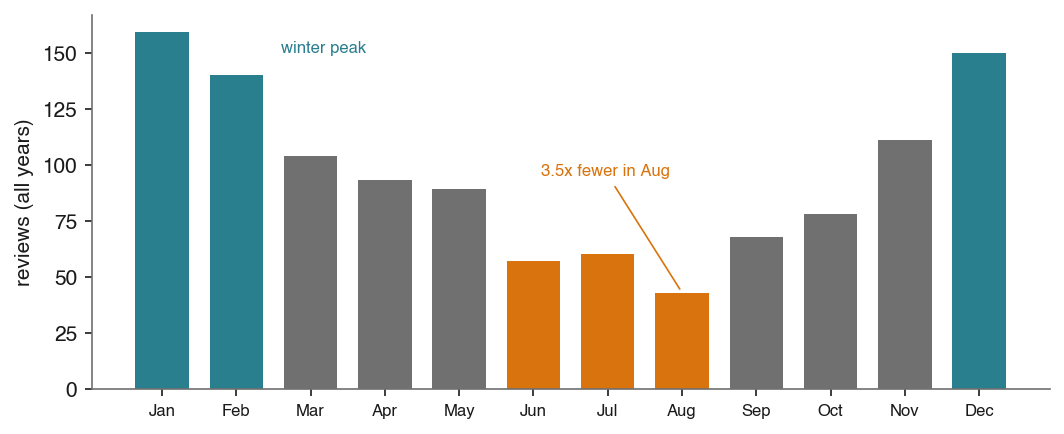
Finding & decision. The park rates 4.47★ and reads as a neighbourhood family park (kids/playground 125 mentions, family 82, quiet/calm 63) whose most-loved quality is its geometry — small and enclosed enough to watch children from a bench. Review volume in Dec–Feb runs ≈3.5× August, yet only 9 of 446 texts mention heat or shade: summer demand is suppressed, not expressed — independent behavioural confirmation of the UTCI analysis, invisible to any complaint-reading. Every 2026 one-star review is a single governance failure (Dubai Municipality app court bookings refused at the gate). Six personas — Playground Parent, Booked-Court Footballer, Quiet-Seeker, Morning Mover, Generational Local, Cat Steward — now ground the design programme and replace the generic LLM personas previously on the roadmap. Two July 2026 reviewers photographed the Municipality’s “Your park, your vision” QR consultation posters in the park — the competition’s engagement campaign is itself visible in the corpus.

Tree-gochi: a physical stewardship prototype (areas 2 & 8)
Question. The analysis established where the park overheats and what shade is worth (52.6 °C open vs 48.0 °C under canopy; tree #113 = 59% of in-park shade) — but those numbers are invisible to a park visitor. Can the vegetation itself communicate need and invite stewardship, cheaply enough to test before proposing?
AI method. A working hardware demonstrator was built in one AI-assisted session: the dev board’s true identity was diagnosed by systematic bus probing (it was not the product it was believed to be); a pixel-exact interactive mock was published for approval before any device code, its port-map table becoming the build spec; and the board now runs a four-tier pixel Ghaf whose canopy degrades as soil drains — the alert threshold reusing the project’s own UTCI ≥38 °C category boundary — while broadcasting one JSON state line per second to a live browser twin. Watering works identically from physical buttons, web or serial. The iot agent then requested the 3D-viewer link from the flir agent over the team bus; it was implemented, reviewed and committed the same day.
Finding & decision. A legible “vegetation tamagotchi” — a Ghaf that wilts, asks “PLEASE GIVE ME WATER!” and recovers — ran on real hardware within a working session, driven by the project’s own comfort thresholds (removing auto-refill is what makes it stewardship: the tree’s fate is the visitor’s responsibility). If employed: adopt as the prototype for a stewardship interface — ambient indicators on high-value canopy (starting with #113) tied to real soil-moisture and heat data. Per the brief, the AI contribution is the process (hardware diagnosis, mock-to-spec, agent-to-agent integration); the proposal does not depend on installing this hardware. Video demo ·
06 — Integrity
What separates “we asked an AI” from a verified analysis

Two independent methods, one answer
The flagship credibility claim: a spatial radiation model (SOLWEIG) and a point energy-balance model (ERA5-Land + thermofeel) were built from different data along different physics, and converge on the same peak comfort value.
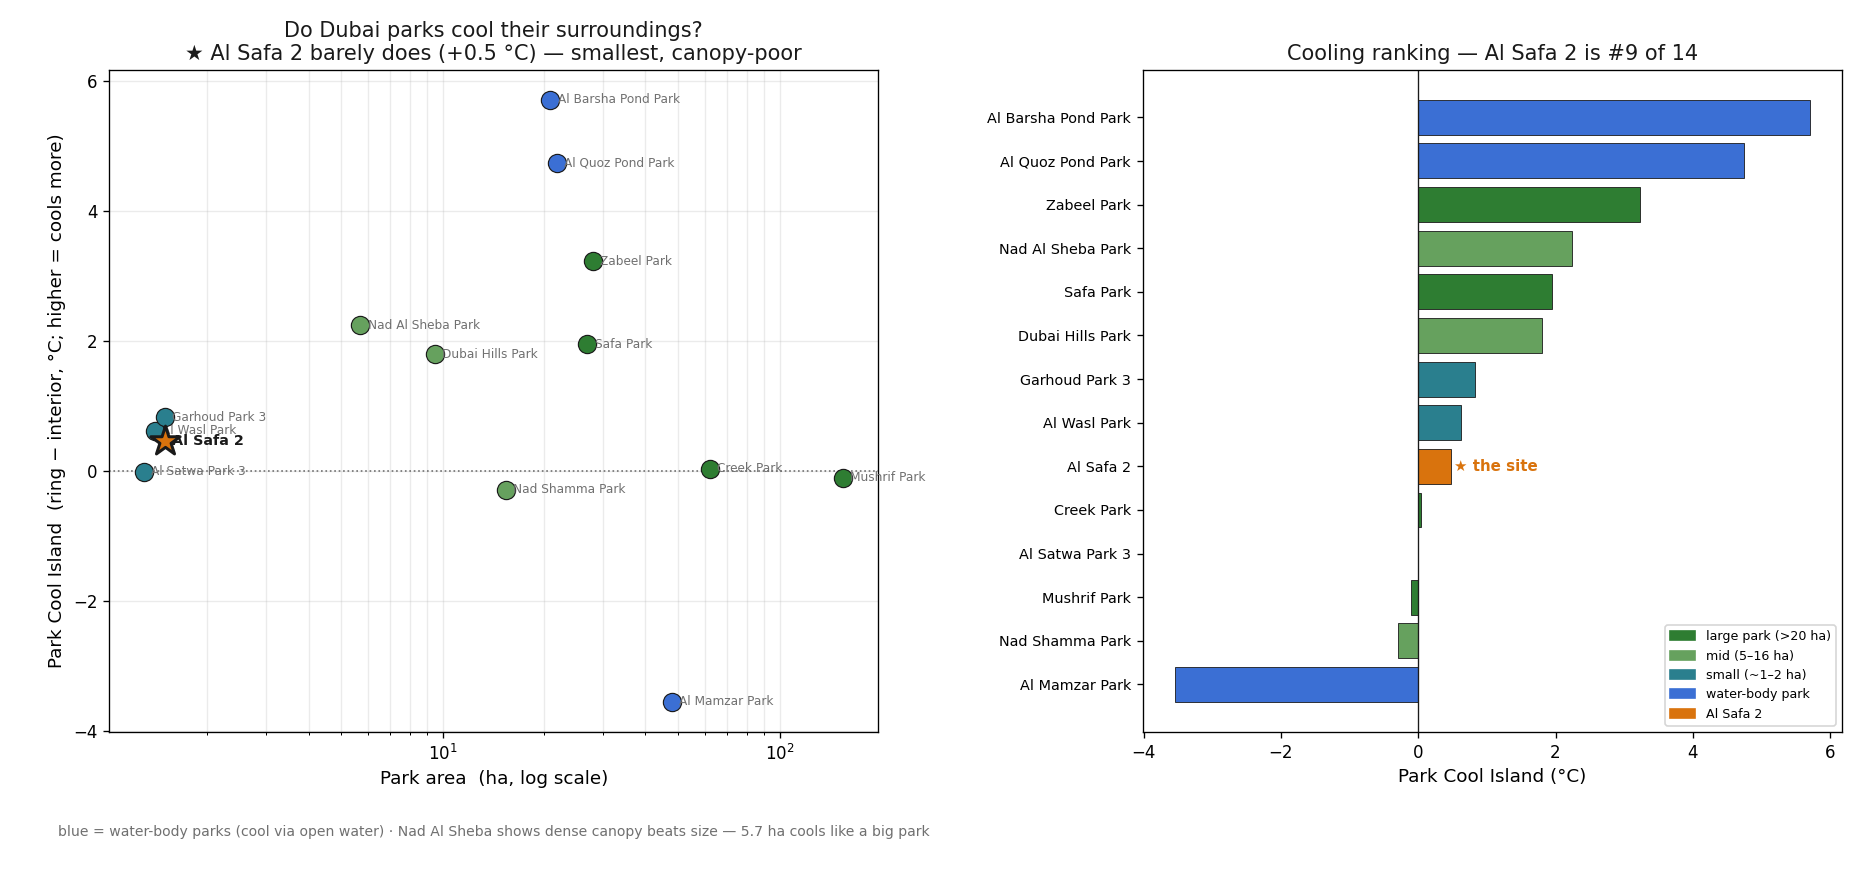
The park-comparison PCI (+0.47 °C) likewise reproduces the centre-ring PCI (+0.40 °C) by a second route.
A closed predict → verify loop
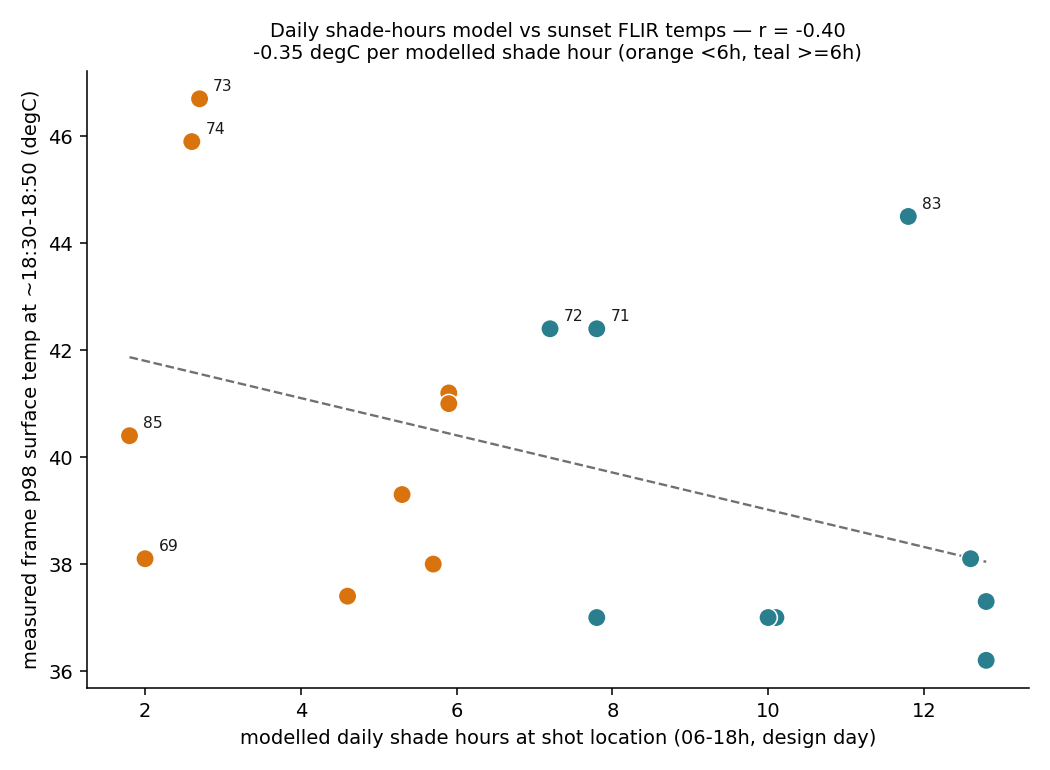
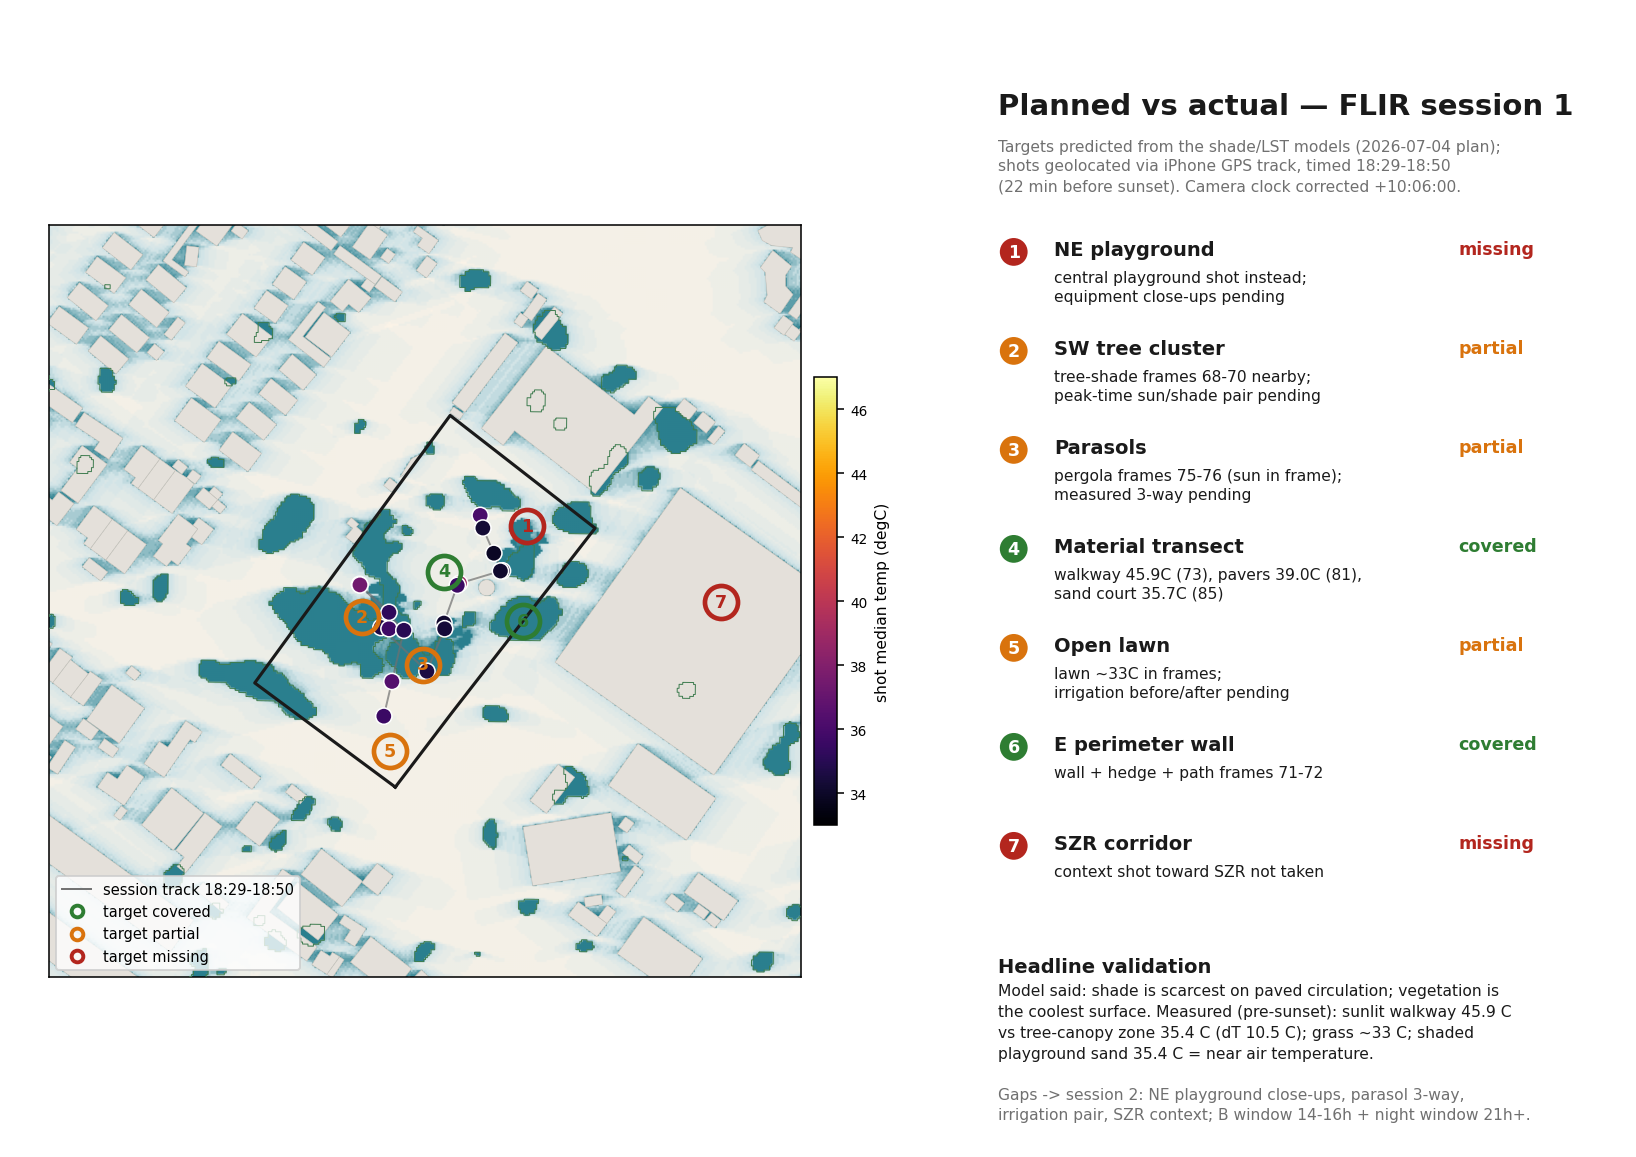
The shade and comfort models predicted the on-site ranking — the NE playground worst, the SW canopy best — before the field visit. Handheld FLIR thermography then measured the contrast, and a sensitivity test confirmed the conclusion is robust to camera settings.
↻ the discovered limit feeds the next field plan — the loop closes
Cloud → field species check: AI-assisted plant identification
The satellite canopy model tells us where the trees are, not what they are. Closing that gap put a second AI in the loop. Tree and understorey photographs taken on site were uploaded to iNaturalist, whose computer-vision model proposes a species for each photo, which the naturalist community then confirms or refines. We pulled the resulting identifications back through the iNaturalist API and snapped each observation to its nearest satellite canopy patch (within 8 m) — turning anonymous pixel clusters into a named species list.
Twenty vegetation records resulted, eight of them our own field photos. Critically, the single most important tree — cluster #113, which supplies 59% of the park’s shade — now carries real names: Neem (Azadirachta indica), Cordia and Plumeria obtusa. Species identity is what upgrades an order-of-magnitude carbon estimate into a defensible one and lets the planting palette favour proven, low-water, non-invasive species.
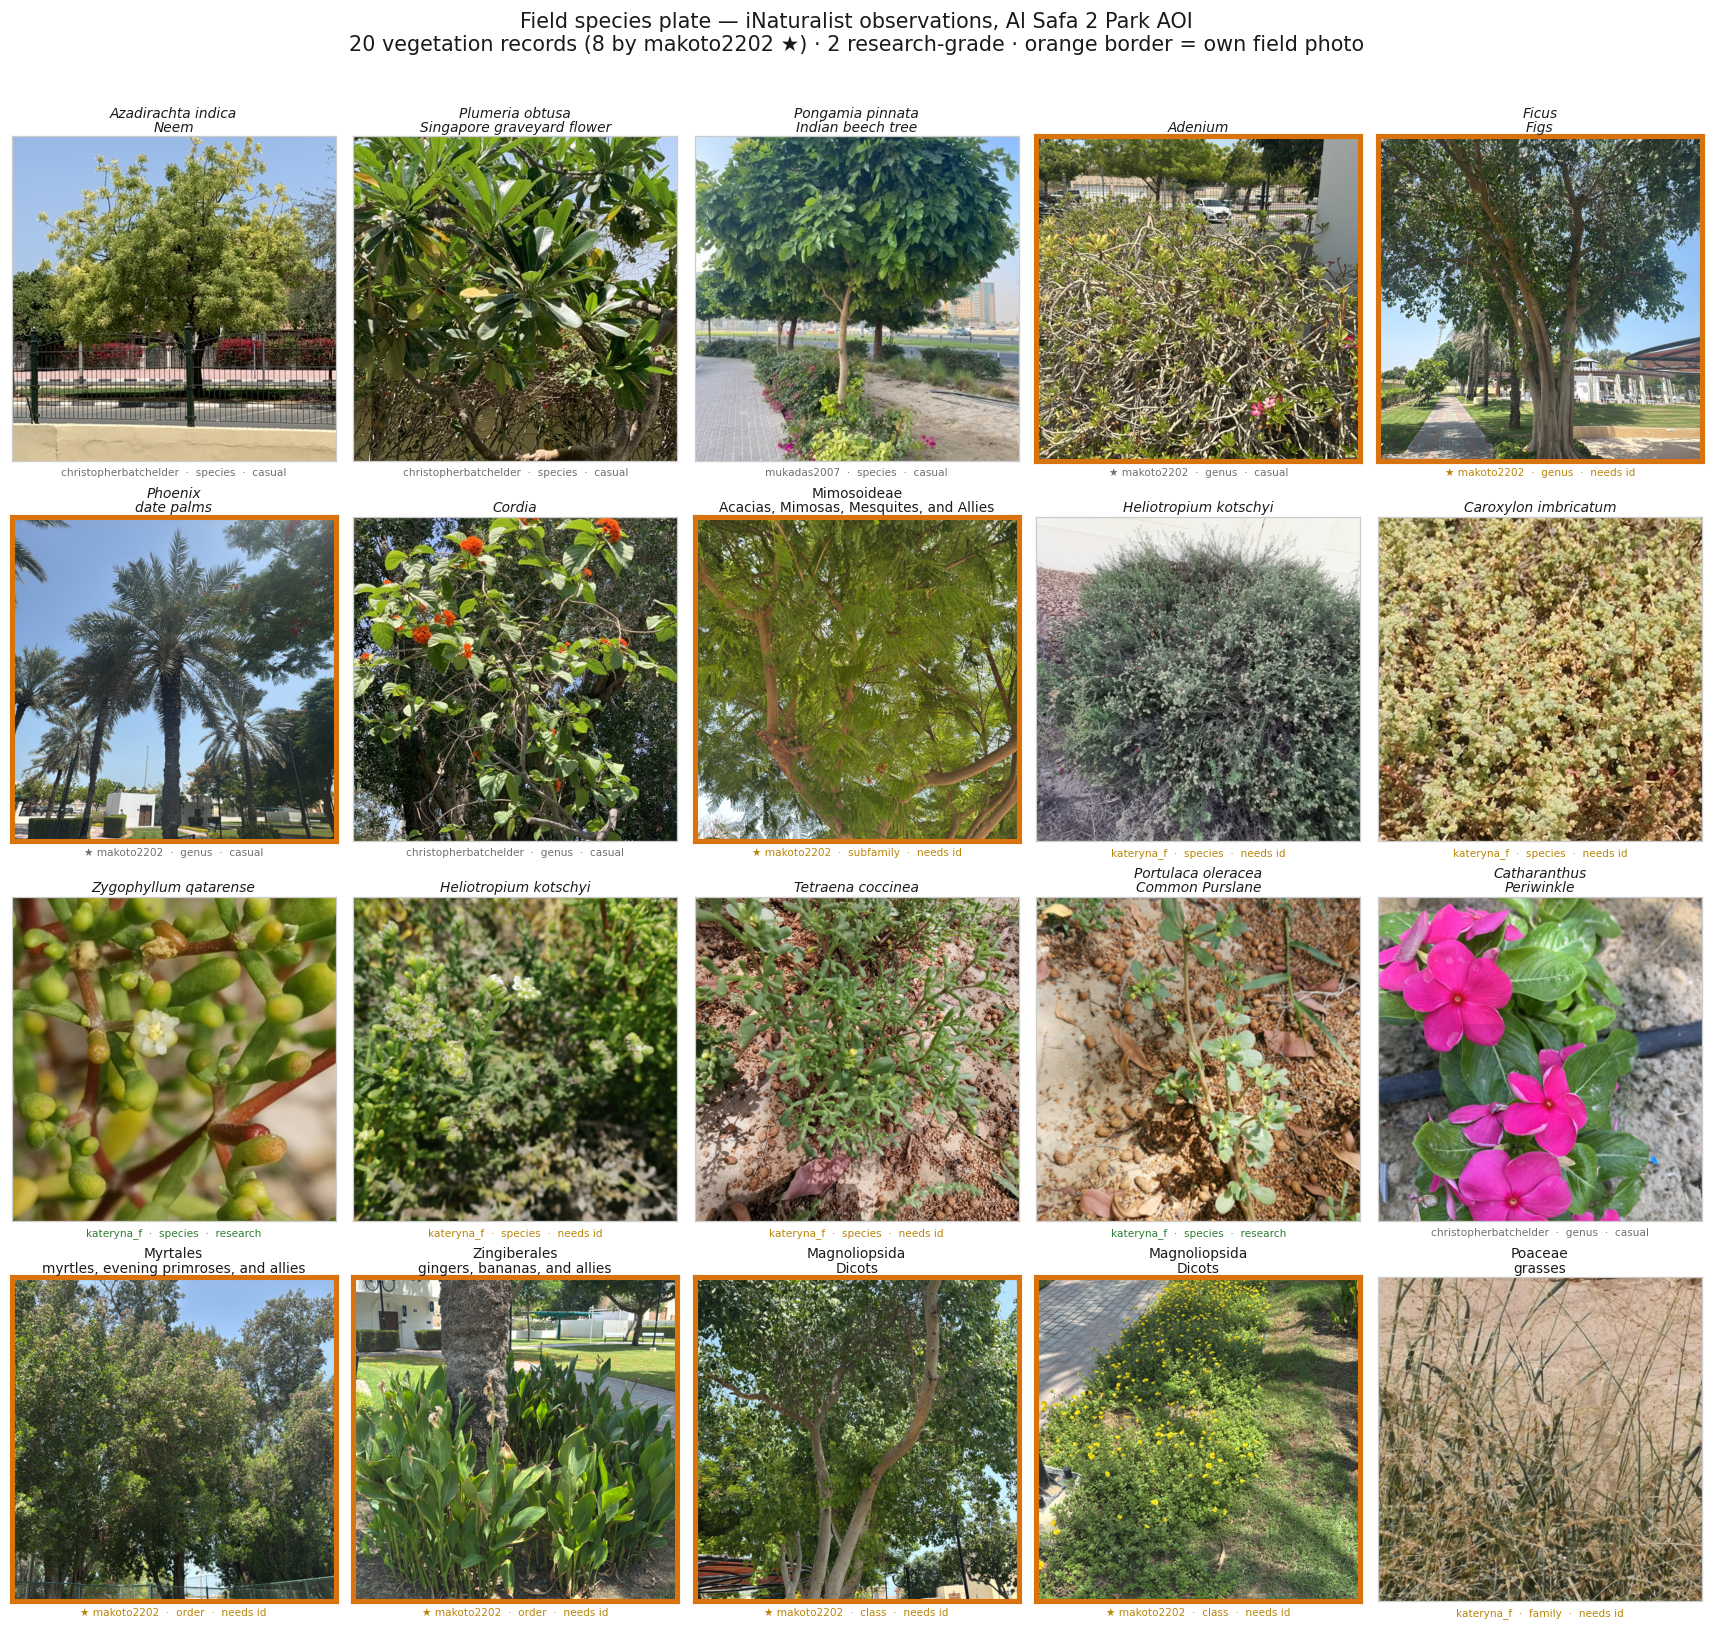
A phone camera plus a public AI vision model is the cheapest, most replicable ground-truth in the whole method — and every identification stays publicly auditable on the observer’s iNaturalist profile. Caveat: many records are confirmed only to genus or higher, so species-specific carbon coefficients are applied only where the identification is firm.
Honest negatives, kept on the record
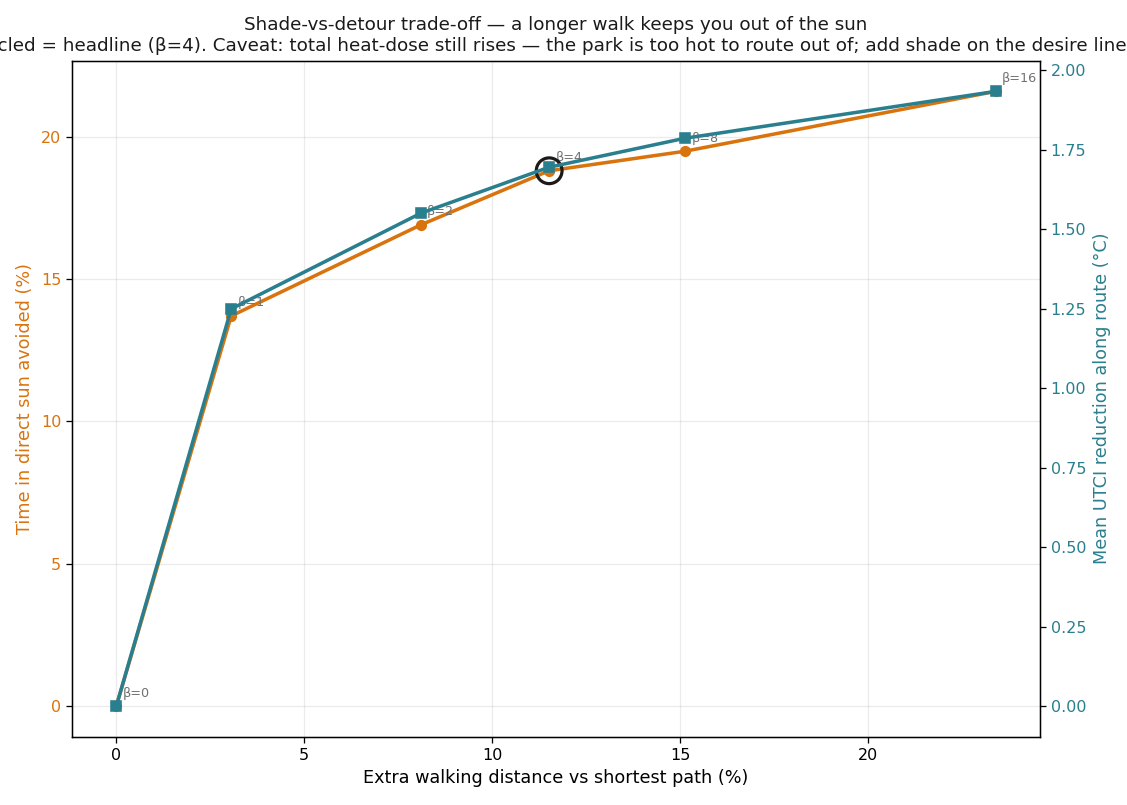
- Detours can’t beat the heat. The pedestrian ABM shows cumulative heat-dose does not drop — the whole park is “extreme” — so the conclusion is to add shade on straight lines, not to reroute.
- Mist is under-modelled. SOLWEIG cannot represent evaporative air cooling, so mist is justified from a separate wet-bulb-depression analysis instead.
- Photogrammetry is parallax-limited on a single forward walk — a capture-geometry limit that held across every tool, now documented with an orbit re-shoot plan.
07 — Design model
The design model: uncertainty made legible, not guessed
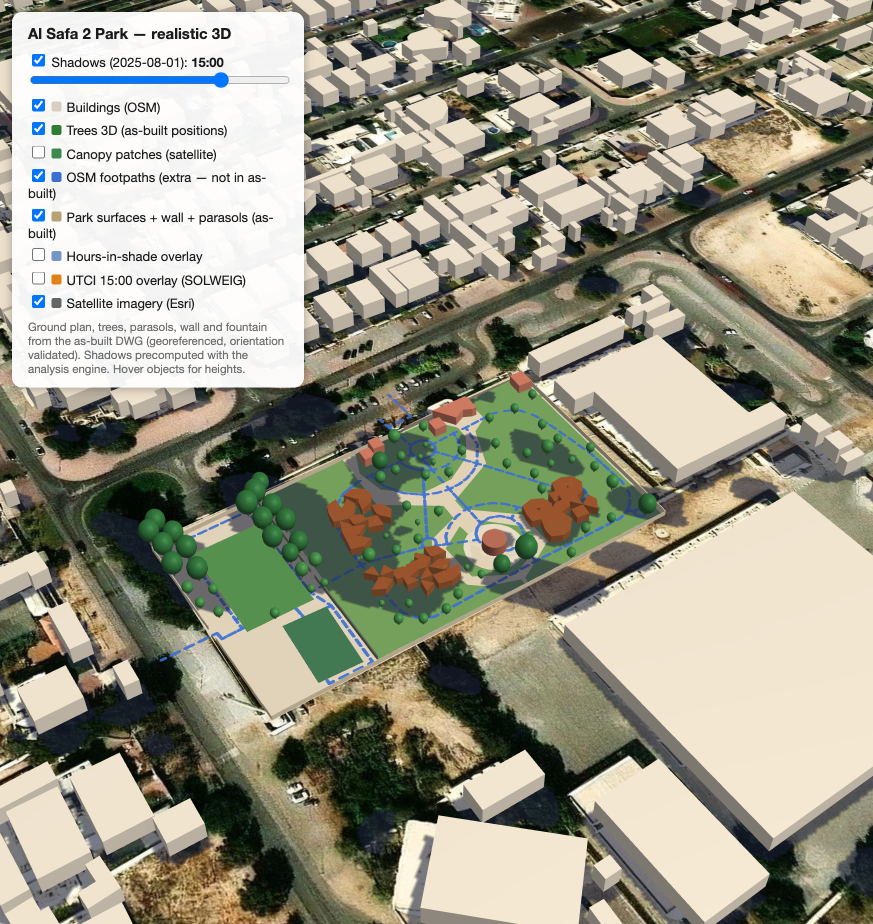
The geometry that constrains the generative work has to be trustworthy first. Proposal 2 begins from one authored artefact — the project’s AutoCAD drawing — and every output is a projection of it rather than a second model that could drift. Two extraction routes were built; AutoCAD’s own vector PDF export won, because it has already resolved every hatch into filled paths, so the 385 self-intersecting boundaries that defeat a raw DWG reader never arise. It reads 41,520 paths across 20 layers and fits them to the drawing’s metre frame with a median alignment residual of 0.05 m, at a scale agreeing to 0.1% with the scale derived independently from the multi-sport court’s known 41.2 m side.
That route also retired a false alarm of our own making. Bounding boxes built from the broken rings put the drawn park at ~253 × 148 m against a surveyed ~165 × 92 m — a 1.5× mismatch reported as a drawing error. Filtering to non-self-intersecting rings gave 159.8 × 68.1 m for the same layers: the inflation was an artefact of our reader, not the drawing. The retraction is recorded rather than quietly dropped.
The drawing carries no elevation data, so every wall, roof and sail rim in the 3D model is a height somebody decided on — and until that decision is visible it is indistinguishable from fact. Every value lives in one config, and a schedule restates each with its basis and a confidence label. Because a spreadsheet is a poor way to judge whether a sail rim clears a slide, a generator renders one review card per element — plan location beside an elevation silhouette — as an annotatable PDF. It came back annotated by hand the same afternoon:
| Element | Assumed | Corrected |
|---|---|---|
| Court & perimeter wall | 2.5 m | 2.0 m confirmed |
| Perforated metal canopy | 4.0 m slab | 4.0 m, 4–6 mm laser-cut plate |
| Fixed benches | 0.44 m seat | 0.44 m seat + 0.78 m backrest |
| Mushroom fountains | assumed family | 3.5 / 3.0 / 2.5 m |
| Splash-shelter bench | 0.40 m | 0.42 m |
First review card to a deployed, corrected 3D model: under an hour, on the same visit. Two things matter more than the speed. The sheet asked the designer to check rather than assume whether the sail canopies clear the slide and the obstacle wall; the answer — the tree house clears, but the slide and obstacle wall were not yet modelled and so could not be checked — is carried as an open item, not papered over. And the schedule states explicitly that tree heights at maturity drive the shade and UTCI figures elsewhere in this report, so if those numbers move, those claims move with them.
One build feeds three outputs, so none can diverge: the web viewer (design-day sun slider, per-CAD-layer solo, fifteen named viewpoints), the Blender scenes (same GLB rebuilt headless, same NOAA solar maths as the viewer, a 12-second day/night loop across 122 real lights), and an IFC4 export that imports the build script as a module and tags all 56 elements with their source CAD layer and height basis — “assumed, see schedule” — so the uncertainty travels with the geometry into any BIM tool that opens it. That export replaced a planned manual remodel in Revit: a second independent redrawing that could have disagreed with the CAD for no reason. Catalogue equipment was handled the same way, including the failure case — one manufacturer DWG will not decompress at all, so rather than fabricate a plausible gym the build script states “SOURCE FILE UNREADABLE” in its header and the massing is flagged low confidence.
A drawing without elevations forces a choice: guess quietly, or make the guess visible and cheap to correct. Every assumed height carries its basis and a confidence label, travels into the BIM export as metadata, and went back to the designer as a card she could annotate by hand. The output is not manufactured certainty — it is uncertainty made legible.
Operating the 3D tool by agent — and by voice
Everywhere else in this report, AI analyses or generates. This is the one place where it operates a professional tool directly. Blender was driven two ways, and the report should be precise about which did what. The headless route (scripts run by Blender from the command line, no window) is what builds the deliverables: stills, the day/night loop, the walkthrough. The live route is a running Blender GUI exposed to a Claude agent over the Model Context Protocol (the open-source Blender MCP add-on, a local socket on this machine), so the open session can be queried and driven in natural language: move the camera to the majlis, report the clearance between the sail rim and the slide, list what is above four metres, switch the render engine and show me the street lamps at night. With voice dictation (Superwhisper) in front of it, that instruction can simply be spoken — the designer inspects a 3D model by talking to it, while both hands stay on the drawing.
The live route was faster wherever the question was how does it look: camera framing, lighting levels, the day/night cycle, whether an assumed height reads right in space. Each change is visible the moment it is made, where the headless loop costs a rebuild and a render per guess — the street-lamp wattage, the viewpoint list and the EEVEE-versus-Cycles decision were all settled by looking, not by iterating files. That immediacy is why it earned its place, and it is also why it needs a rule. Anything decided in the live session is written back into the versioned scripts and the model is rebuilt headless — the GUI is where a value is found, the script is where it lives — so the reproducible pipeline stays the single source of truth and nothing in the deliverables depends on an undocumented click. The one thing the live route may not do is author geometry: positions, counts and dimensions come from the drawing, through the build script, never from a hand edit in the viewport.
The practical gain is speed at the point where 3D work is normally slowest: judging whether an assumed dimension actually looks right in space. That judgement used to require opening the file, navigating to the element and eyeballing it. It now takes a spoken sentence, the answer is on screen, and the number goes straight into the height schedule the next paragraph describes.

08 — The film
The 1-minute film, built the same way as the analysis

The mandatory film could have been the weakest link in the integrity story — generative video invents geometry freely. Instead the prototype (anim/slideshow/, live on this site) was built like every analysis above: deterministic, scripted and reproducible. A headless-browser pipeline drives the project’s own 3D viewer — the digitized Proposal 1 model under the real 2025-08-01 NOAA sun — through a coded shot list, steps the character animation on a frozen scene clock, and re-renders every frame on demand. No generative AI touched a single pixel; the film’s data strip carries only the corrected, cross-validated numbers, in English and Arabic.
The build itself exercised the multi-agent workflow end-to-end. The writer agent issued a machine-readable brief for the film’s low-poly residents — 15 scene groups with model anchors and a definition of done () — the proposal_one agent implemented it, the iot agent supplied the Tree-gochi display capture, and every delivery was accepted only after frame-diff verification. That QA gate caught real defects a human reviewer would have missed at a glance: a café cast placed invisibly inside the building shell, a viewer camera preset aimed 20 m off the café’s true centroid, and a shot whose character group was silently toggled off. Human ground truth steered the loop the other way, too: the designer’s field knowledge corrected a building identity (majlis vs. security kiosk) and contributed the film’s most local beat — Ramadan-night beach volleyball beside the mosque — neither of which any model output contained. The residents themselves are logged in the fidelity register as illustrative characters, not simulated users, and are excluded from every before/after statistic.
The film is process evidence, not decoration: agents briefing agents through written specs, machine verification gating each handoff, and human field knowledge correcting the machine — the same predict → verify → refine discipline as the thermal analysis, applied to storytelling. The remaining photoreal pass keeps the constraint: each captured frame becomes the geometry-locked seed for image-to-video, so ambience can move while the design cannot be hallucinated.
From a hand sketch to a photoreal frame
Every image in the film descends from a drawing. The chain below is the whole argument in four steps: nothing downstream may invent geometry that is not present upstream.
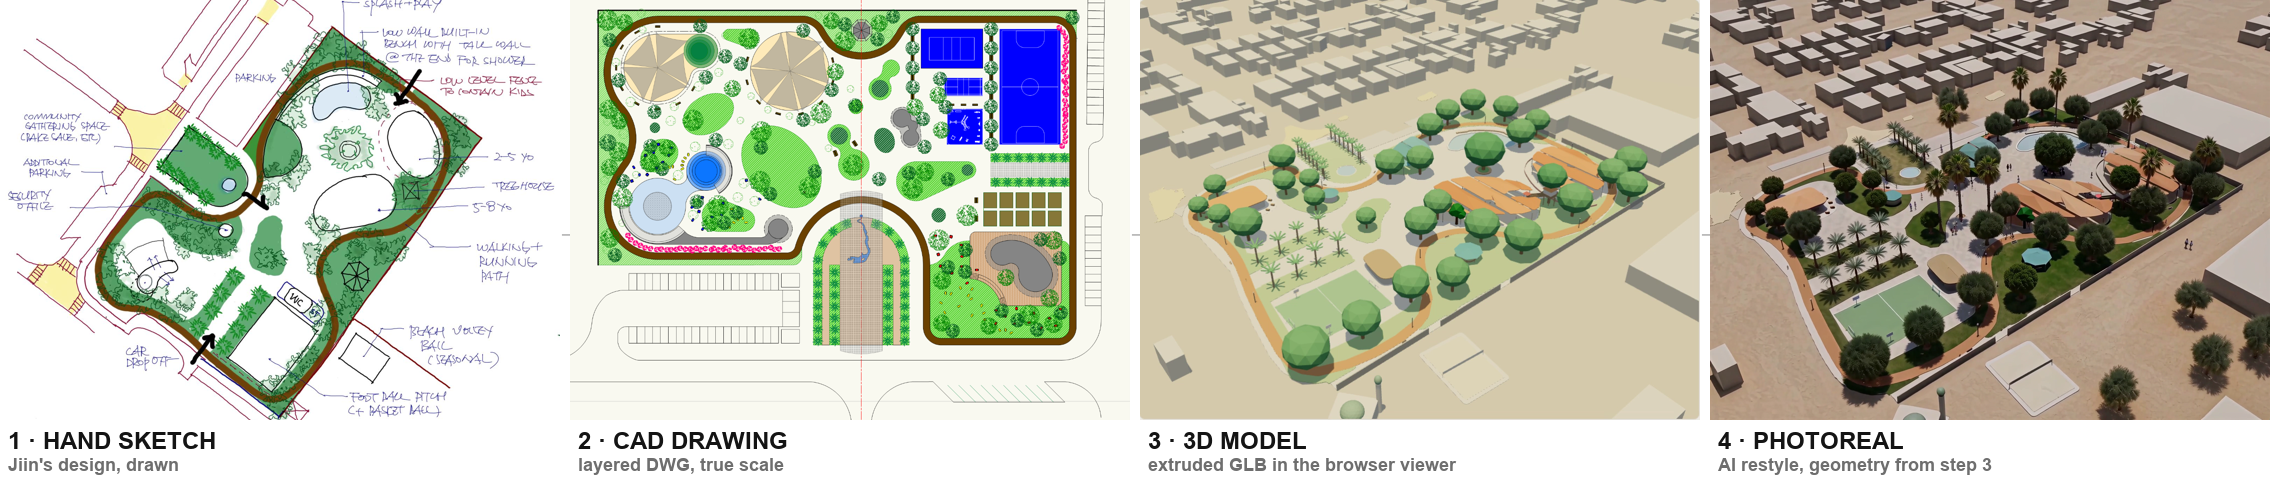
The residents were specified in writing before they were modelled (): fifteen named scene groups, each with an anchor coordinate and a narrative reason to exist. They are logged as illustrative characters, not simulated users, and are excluded from every before/after statistic.

Making it photoreal without letting it invent
The deterministic film above proves the narrative, but reads as an architectural model. Making it photoreal meant solving one problem: photorealism that cannot alter geometry. Three generations of experiment, each failing in a way that narrowed the answer.
Asking in words failed. Instruction-edit models (FLUX.1 Kontext, nano-banana, Qwen-Image-Edit) expose no conditioning input and no strength control, so fidelity could only be requested, never enforced — and a ~200-word engineered constraint prompt performed worse than the words “make it realistic” on the same model. Layout drifted and a palm avenue appeared that the design does not contain.
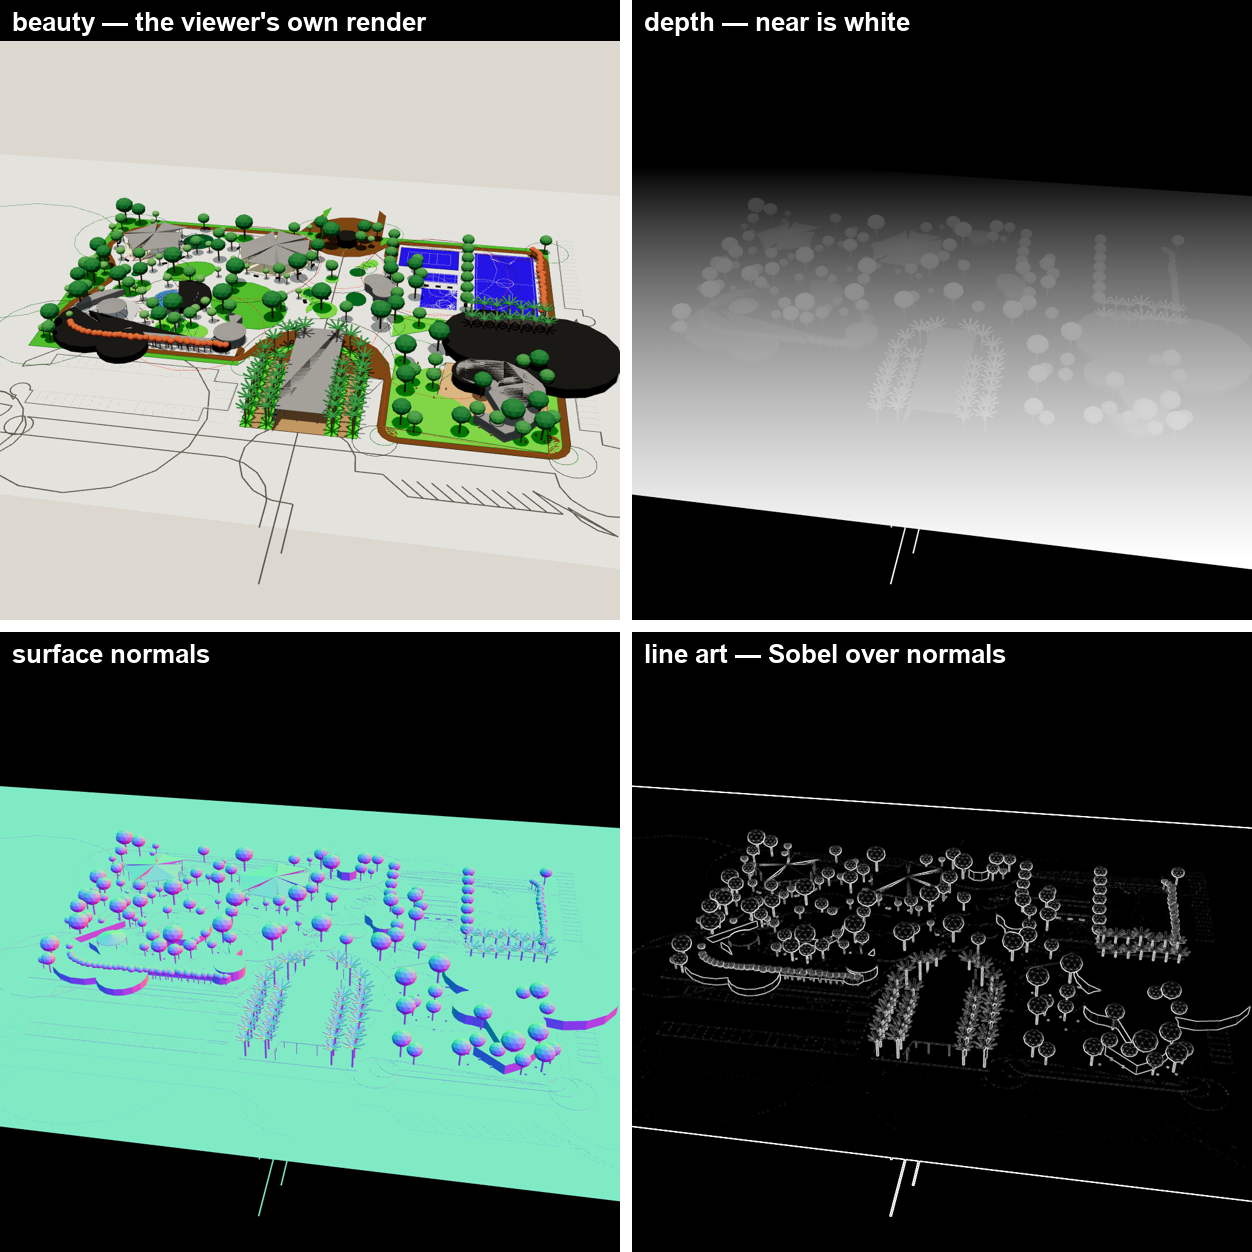
Supplying the geometry worked. Rather than let a model estimate structure from a picture, we render it: depth, surface normals and line art straight from our own three.js scene, exact by construction. Fed to ControlNet — an attachment that lets a generative image model be steered by a picture rather than only by words, so a depth map or a line drawing dictates where things go — with a photorealism-tuned Stable Diffusion XL checkpoint, these preserved tree positions and counts where prompt-only methods had deleted roughly three quarters of the crowns.
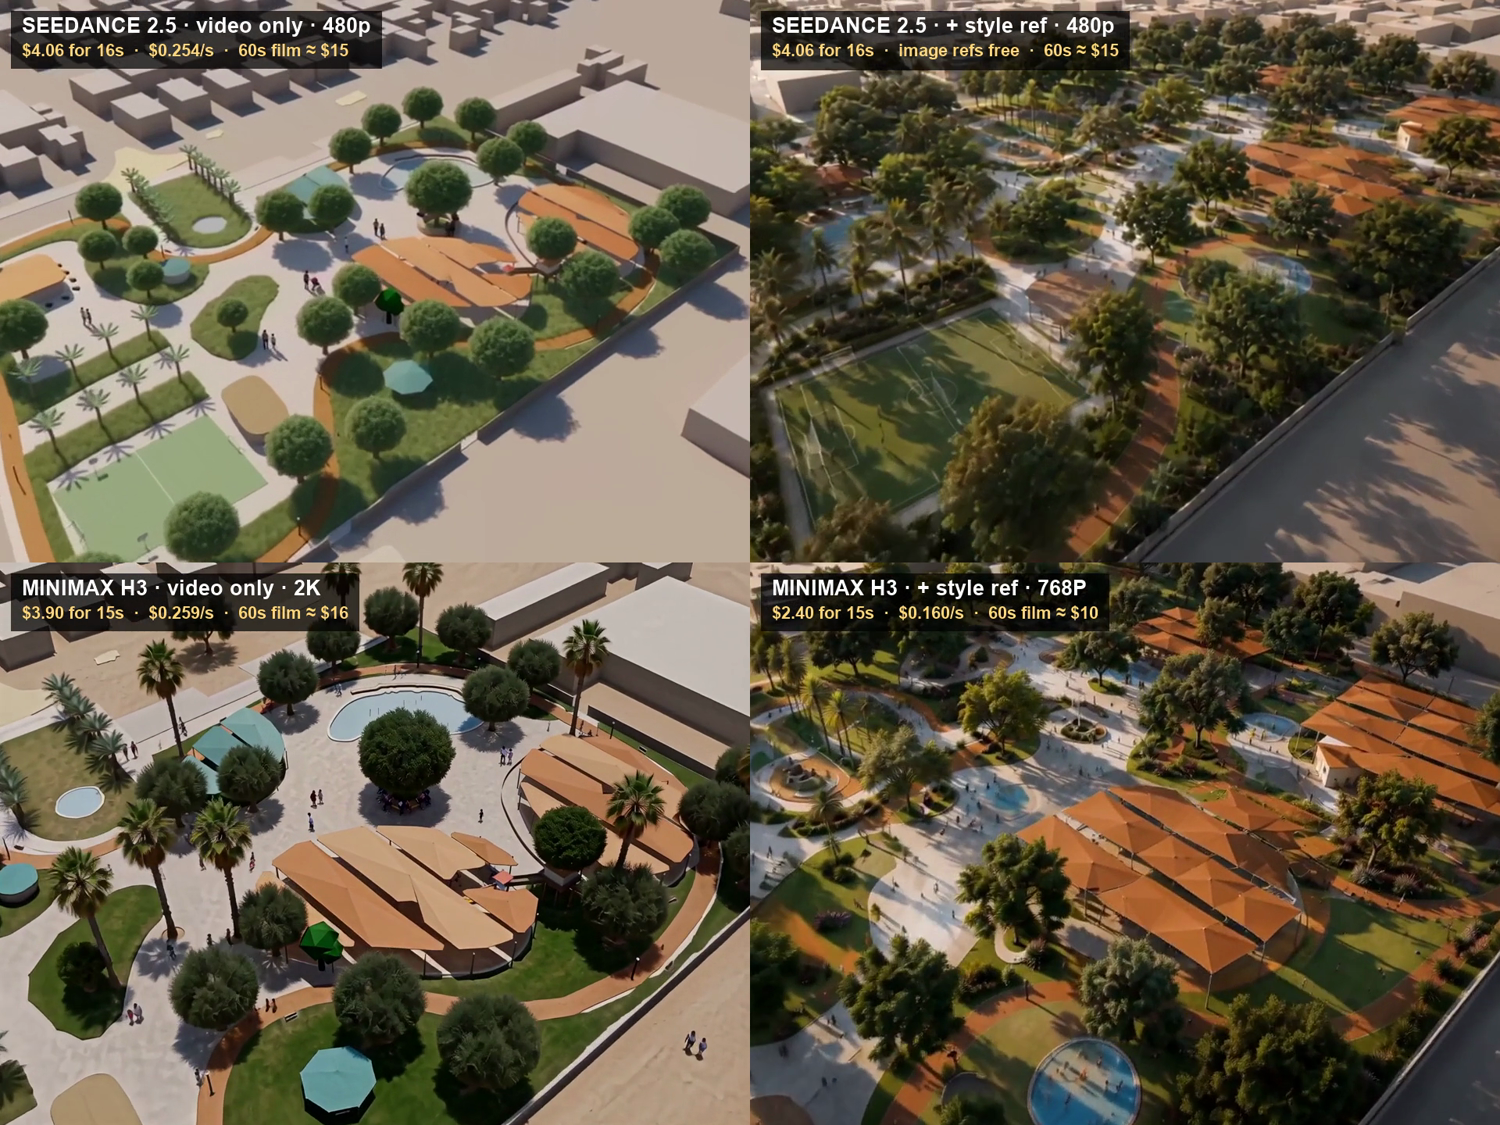
Conditioning on motion worked better still. Seedance 2.5 — ByteDance’s video model, released 31 July 2026, which generates up to 30 seconds in a single take — accepts a video reference, so we render the camera move itself — an eased spline through waypoints that reuse the film’s own shot poses — and the model follows our geometry through a continuous 16-second flythrough, including a descent from 135 m to 45 m. Two findings came out of it: a style-reference image overrides structural conditioning at four seconds but far less at sixteen, because a moving camera supplies parallax the model can infer real structure from — so short tests actively mislead; and a video reference constrains motion as well as geometry, so our viewer’s oscillating figures were faithfully reproduced as mechanical crowds until we removed them and let the model populate the park.
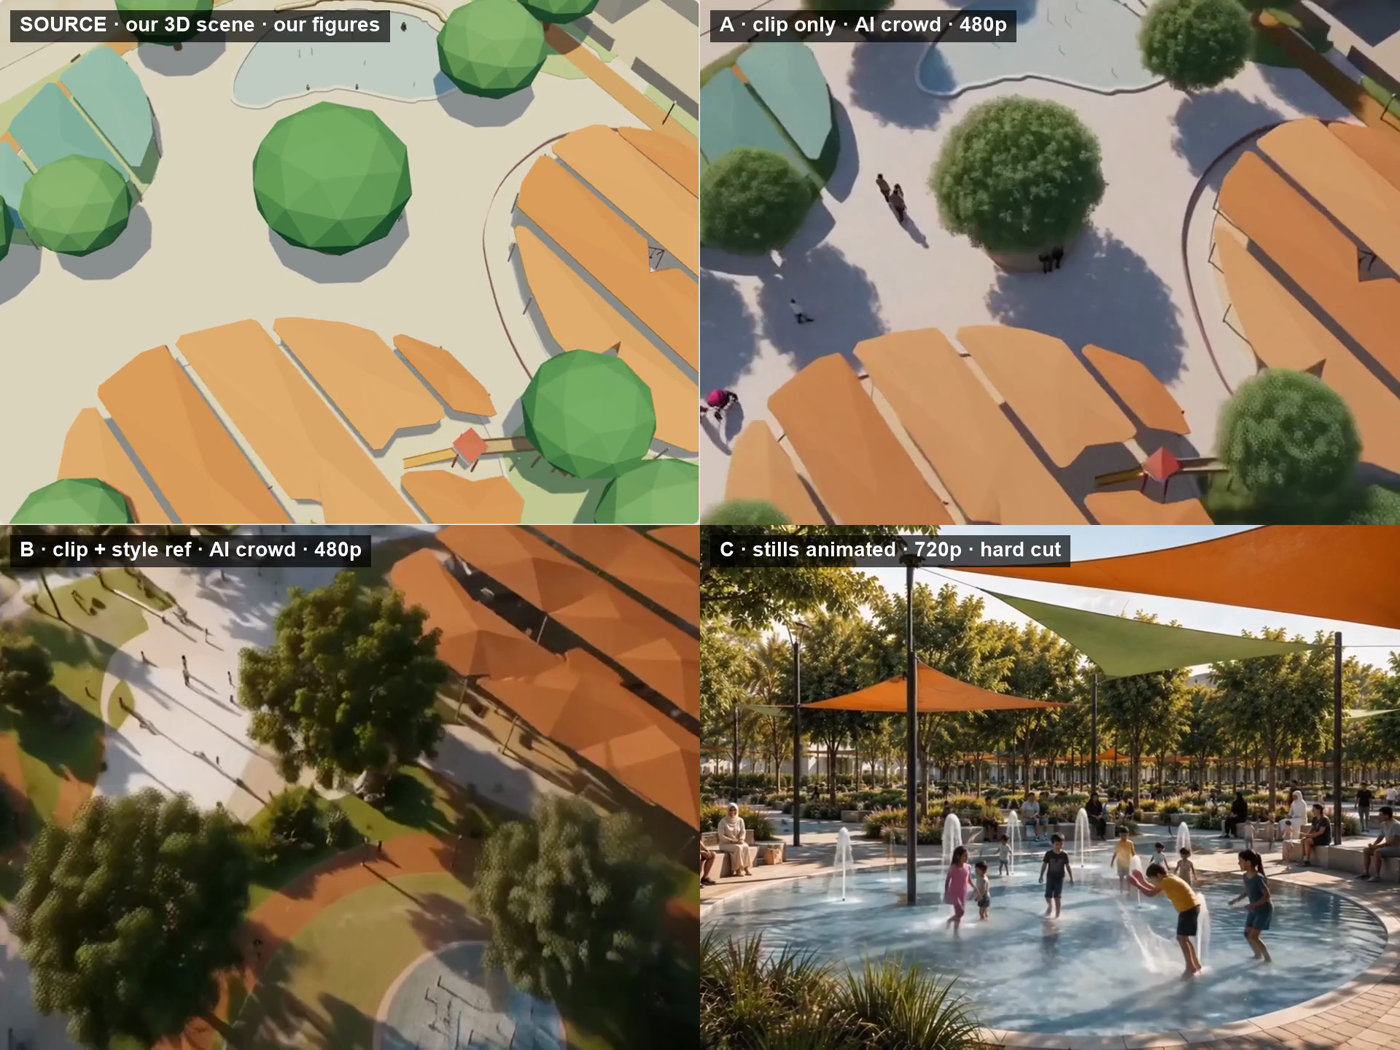
The rule we settled on is that shot type follows claim. Aerials carry the loop length, the shade percentages and the walkshed, so they stay geometry-locked. Eye-level vignettes show experience and assert no number, so they may be treated more freely. People are generated deliberately — the film claims nothing about people, so the built design is locked and the crowd is not.
The same boundary runs back into the 3D pipeline above, drawn at what a CAD drawing and a manufacturer’s coordinates can actually answer. Locked, because it comes from the drawing or from real placement data: massing, position, count, dimension, CAD-layer colour — sail footprints, tree crown positions, court dimensions, fixture heights. Delegated, because no source file contains it: surface finish — the rope-net texture inside the sensory dome, perforation detail on the metal canopy, photoreal materials and vegetation. The generative stage is free to invent plausible surface detail precisely because it is never asked to invent a position, a count or a dimension.
Choosing the model — and what it actually cost
Five video models were run on an identical conditioning clip and prompt, so the only variable was the model. Every rate below is measured from account-balance deltas, not quoted — published prices proved wrong in every case we checked.
| Model | Conditioning | Layout | Paths | Descent | Measured rate | 60 s film |
|---|---|---|---|---|---|---|
| MiniMax H3 | video + image refs | held | held | held | $0.16/s @768P · $0.259/s @2K | ~$10–16 |
| Seedance 2.5 | video + image refs | held | held | held | $0.254/s @480p · ~$0.47/s @720p | ~$15–33 |
| Wan VACE 14B | depth / pose control | held | lost | lost | $0.04/s | ~$2.40 |
| Wan 2.2 | video (loose) | lost | lost | — | $0.04/s | ~$2.40 |
| Grok Imagine | video edit | partial | — | — | $0.47/s | ~$28 |
Resolution and duration ceilings constrain the deliverable independently of quality. A competition film wants the highest resolution available; a continuous camera move is limited by the per-generation duration cap.
| Model | Resolution range | Max per generation | Reference-clip limit |
|---|---|---|---|
| MiniMax H3 | 768P → 4K (768P / 2K / 4K) | 15 s | 15 s total across refs |
| Seedance 2.5 | 480p → 720p | 30 s | 1.8–30.2 s per clip |
| Wan VACE 14B | 240p → 720p | 241 frames (≈15 s @16 fps) | — |
| Wan 2.2 | 480p → 720p | ~5 s observed | — |
| Grok Imagine | matches the input clip (1024×768 observed) | 15 s | 8.7 s input |
The two survivors trade against each other: H3 reaches 4K but caps at 15 s, so a 60-second film is four takes; Seedance caps at 720p but generates 30 s, so the same film is two takes with fewer joins. For a beat-based cut the duration ceiling is irrelevant and resolution wins; for a single continuous flythrough the reverse.
Depth is necessary but not sufficient for a landscape. VACE followed our depth video faithfully — tree positions, sail clusters, site outline — and still produced a park with no path network, because paths are coplanar with the grass: same distance from the camera, same grey. Depth describes buildings; a park is described by its surfaces. The stills pipeline had already implied this by weighting line art 0.9 against depth 0.6; VACE showed what happens when only the 0.6 can be supplied. It is why a full beauty render — carrying height, surface change, colour and material boundary at once — beats any single geometric channel.
A style reference is treated as content, not as a look — in every model tested. Adding a photoreal reference still improved realism and imported a football pitch and a canopy density the design does not contain, on both Seedance and MiniMax H3, despite an explicit instruction to copy nothing absent from the video reference. Two vendors, the same failure: this is a property of the technique rather than of a product, and prompt-level constraints do not govern reference conditioning.
What we chose, and when we stopped looking. MiniMax H3 at 768P — $0.16/s measured, about $9.60 for a 60-second film — as the cheapest option holding layout, paths, the descent and people; 2K reserved for hero shots at $0.259/s. Two further candidates were priced and deliberately not tested: Wan 2.6 and 2.7 reference-to-video, published at $0.10/s for 720p, which at the 2× multiplier observed throughout would land above H3 at 768P.
The search was stopped at that point, and the reasoning is a project judgement worth recording: model comparison had cost about $5, a further test cost $2–4, and the maximum remaining saving on one film was ~$5. Expected return had fallen to roughly zero while the deadline stayed fixed — the cost of finding a cheaper tool exceeded the cost of the tool. Note also that image references are billed at zero on both surviving models; only the video reference is charged, so the fidelity-versus-beauty choice below is never a budget question.
Self-hosting was tested, not merely costed. A rented L40S ($1.02/hr) ran LTX-2.3 with its Union depth+edge IC-LoRA. It confirmed the economics — 142 s for the first generation, then 36–45 s, about $0.01 per clip against $2.40 on the API, so a four-point parameter sweep costs pennies — and rejected the quality: structurally faithful but stylised, visibly below MiniMax H3.
It also produced the clearest form of the depth finding. Our rendered depth video, through the correct control architecture, placed every object correctly and then rendered the tree crowns as teal umbrella shapes, with the whole ground as uniform paving and no path network. The beauty render through the identical graph kept layout, surfaces and paths. Depth places objects; it cannot describe them, and it cannot see changes between coplanar surfaces. A building is defined by its height; a park is defined by its surfaces — which is why architectural visualisation guidance transfers poorly to landscape.
Then we self-hosted the model we had actually chosen, and it failed instructively. H3's licence excludes local deployment in the US, EU, UK and South Korea, so the GPU was taken in India. It runs on a single H100 — 52.3 GB resident, not the four GPUs MiniMax's own model card implies — and the economics work: 425–458 s per five-second clip at $3.29/hr, about $0.40 a clip against ~$2.40 through the hosted API.
The output did not work. Across five runs, varying the prompt tagging, the sampler chain and the text encoder, it produced beautiful, photorealistic, prompt-faithful Dubai parks — none of them ours — while the same model through the hosted endpoint reproduces our site outline, loop path, tennis court and villa grid almost exactly.
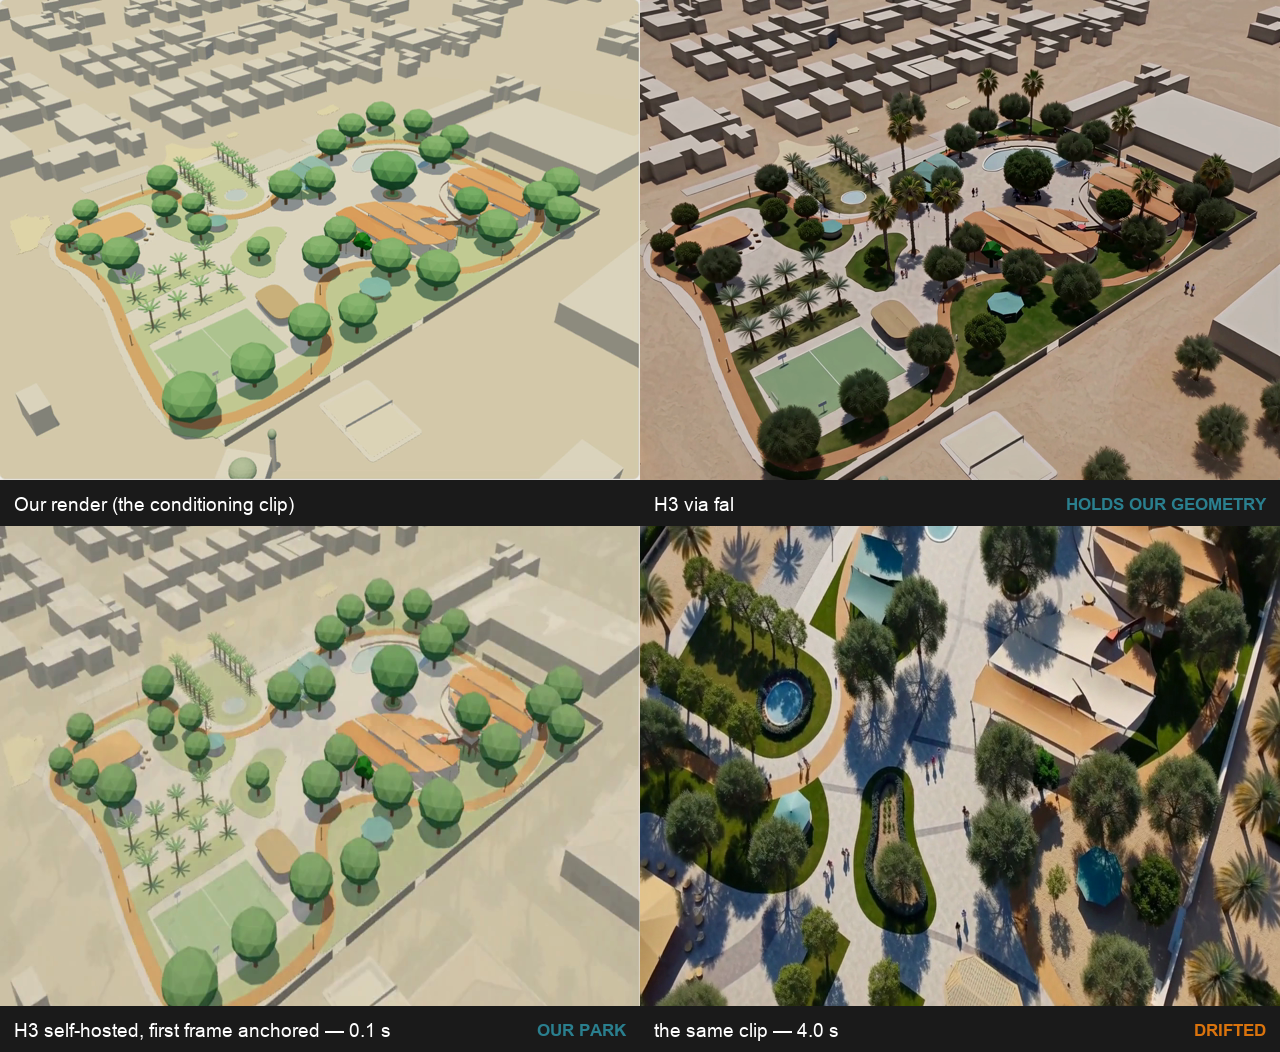
That gradient is the evidence. Our geometry reaches the model and is legible to it, so what fails is specifically the reference-conditioning path — which yields a finding worth more than the saving it was chasing.
A hosted endpoint is not merely the same open weights with a bill attached. The serving stack — quantisation, the reference pipeline, conditioning invisible from outside — is part of the product. Open weights do not make a capability reproducible.
The claim is deliberately bounded: two branches were not eliminated — the bf16 text encoder (~64 GB, which will not fit beside the 34 GB model on one 80 GB card) and the optimised CUDA kernels, which the stock image disables by shipping an older CUDA build. The defensible statement is not reproducible on a single H100 with the quantised weights and the stock template, not impossible. What this costs the project is iteration, not quality: the hosted result is verified correct, so the film is unaffected, and the workflow stays as designed — iterate the camera in 3D where it is free, and spend a generation only on a take already committed to.
Published API prices were wrong by 2–9× in every case checked — one model quoted at $0.05/s billed $0.47/s. Every figure in this report is measured from account-balance deltas rather than taken from a pricing page, and one candidate was very nearly discarded on a catalogue label that turned out to be inaccurate.
Fabrication register: what the tools invented, and how we caught it
Every generative method tried to add something the design does not have. Each was caught by comparing output against the geometry that produced it, and each fix is recorded.
| Fabrication | Cause | Fix |
|---|---|---|
| Palm avenue appeared | prompt named palms while forbidding them | clause removed |
| ~75% of tree crowns deleted | no structural conditioning | line-art conditioning at 0.9 strength |
| Desert dunes in the background | control image had empty margins | condition on a clip that contains real context |
| Sports courts rendered as swimming pools | model misread a flat rectangle | two short corrective nouns |
| Every tree crown turned blue | one colour word in a corrective clause bled across the frame | describe by object and material, never by colour |
| Football pitch imported | came from a style-reference image | verify references against the design |
| Canopy density inflated | style reference showed a denser park | check frames against the before/after figures |
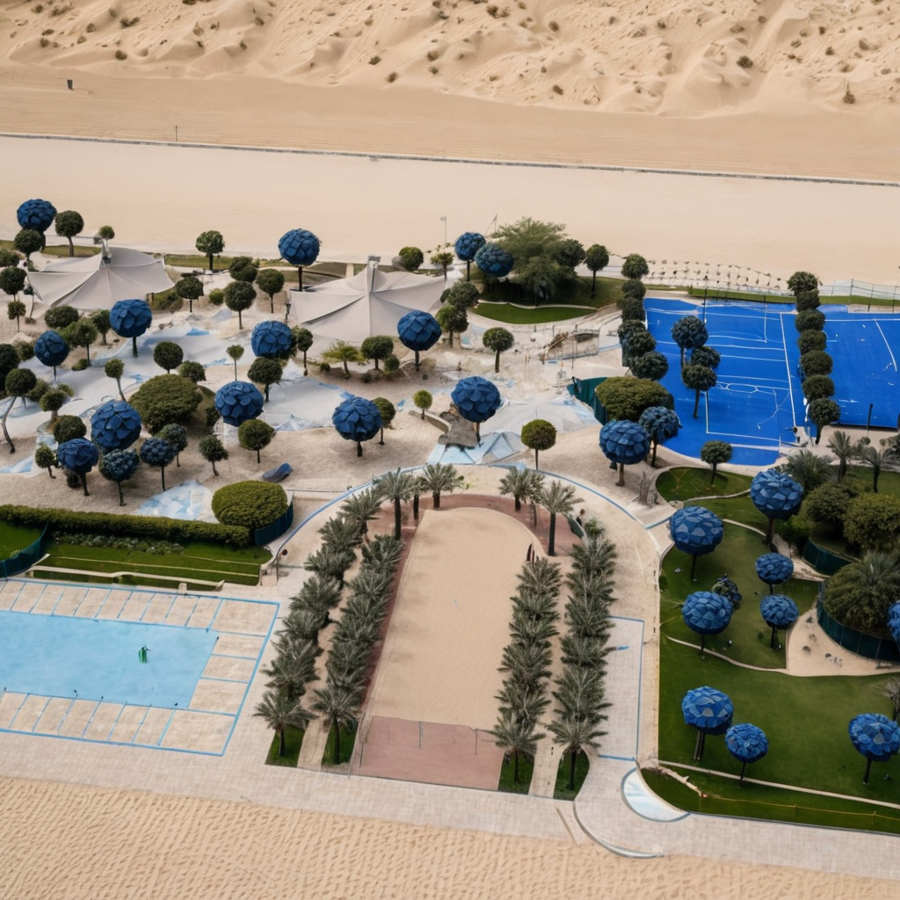
The register is the point. Any entrant can show their best frames; the discipline is only demonstrated by showing what the tools got wrong, how it was detected, and what changed as a result.
08b — The game
Playing the analysis: a game on the model that changed the trees
The hourly shade model was built to score the design by area. In the last week before submission it also became the level of a small game, Shade Run, playable on a phone from this site. The player runs through the proposed park’s day to six appointments in the order the film shows them — yoga at 07:00, the playground at 09:30, the splash pad at 14:00, the Ehsan station at 14:30, the farm at 15:30, the cinema at 18:30 — under one rule that is never written on screen: the longer you stay in the sun, the slower you get; shade recovers you. The clock is the score. The sun at each leg is the design day’s (2025-08-01) at that hour, and what counts as shade is a mask projected from the model by the same triangle method as the design shade run (§07), so the game’s difficulty at 14:00 is the design’s shade performance at 14:00. Nothing in it is drawn by hand: the park is the Proposal 2 model, walkability is a mask of the drawing’s ground layers, and the residents at each appointment are the film’s cast, already standing there.
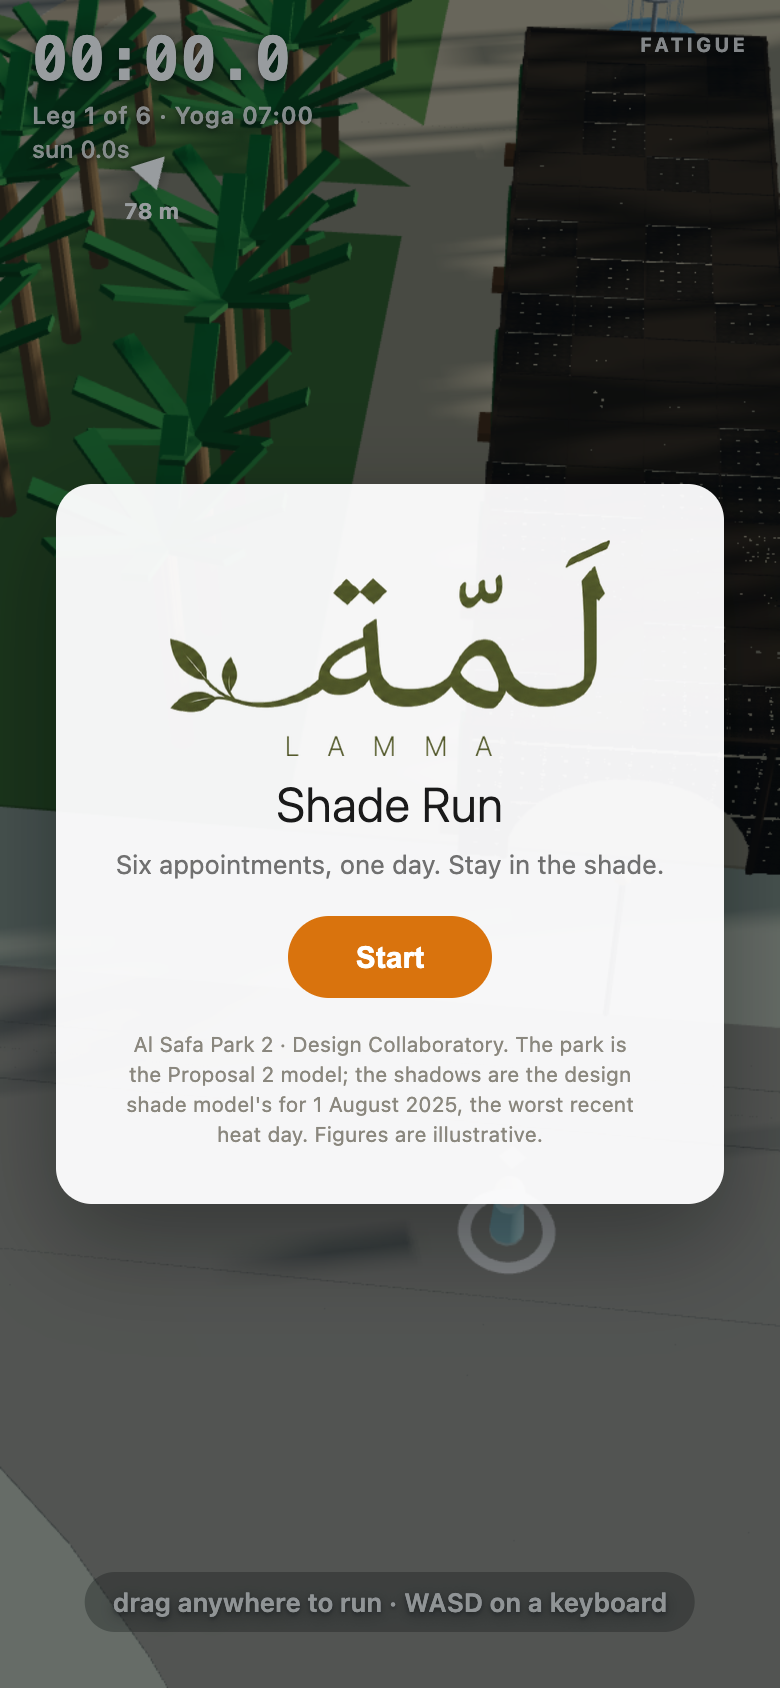
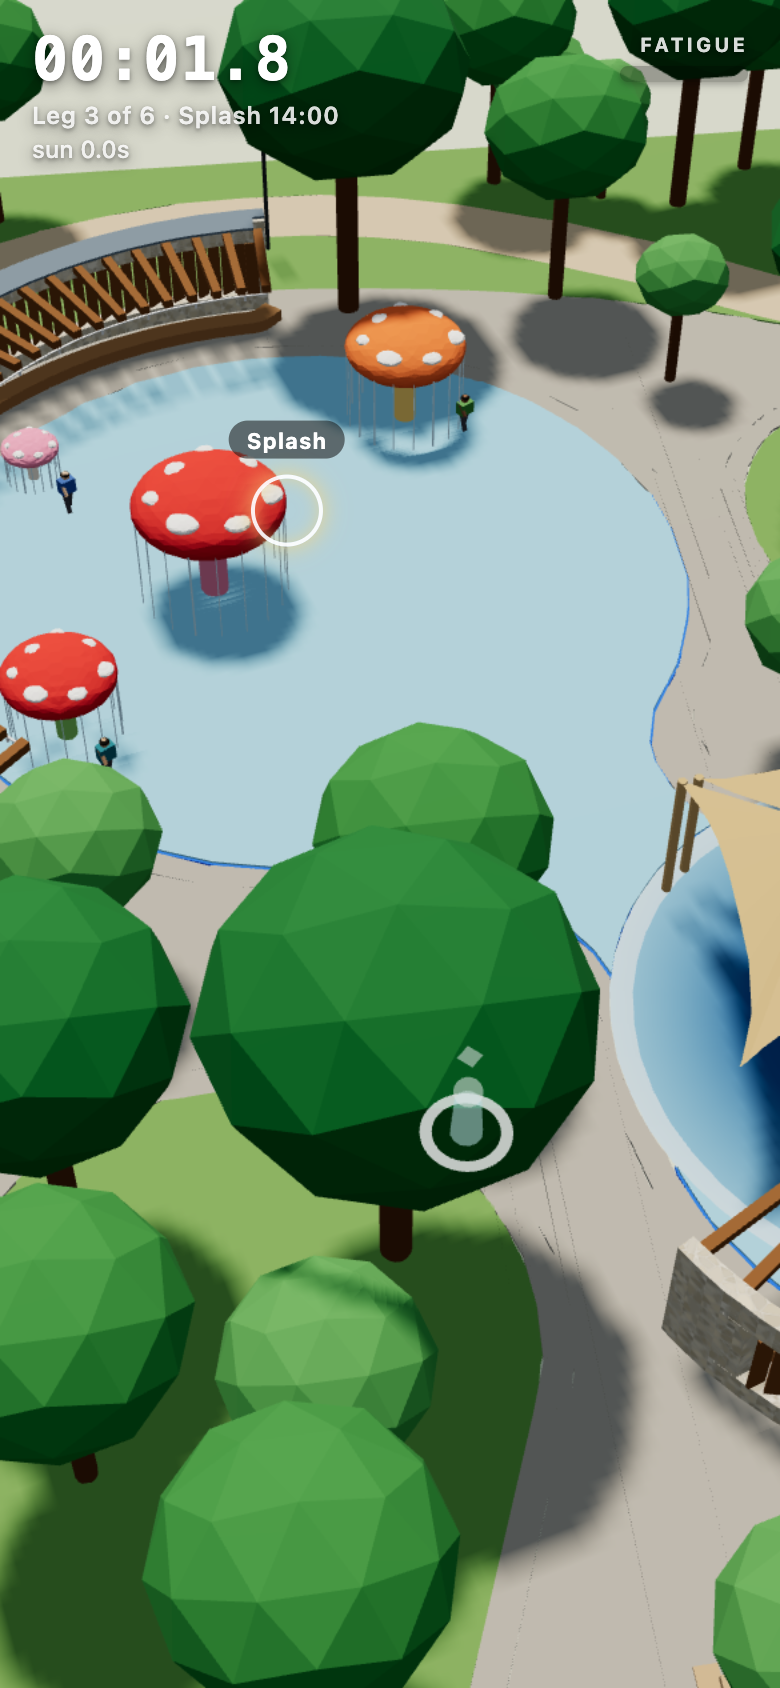
How it was made, and why the rule is small
The game was built with the same brief → build → verify loop as the analysis. One written brief pinned every number; a builder model wrote the code; a headless browser checked every rule — shadow direction per hour, the fatigue curve, arrival, the clock, touch and mouse — before a human played it. The first control prototype was given to four coding agents from four vendors with one identical brief; all four passed the same fifteen checks and the cheapest was fastest, which settled a methodological point cheaply: for a precisely specified feature the brief, not the model, decides the outcome. The rule itself was cut three times by play, not by argument. Six personas with a rule each, a heat bar, a chain multiplier and a review-card ending were dropped as “a design document’s idea of fun”; a coin-collecting version was rejected as untrue to the park; the surviving rule is the one a player learns in five seconds and the one that is literally the shade model.
What playing showed that the area chart could not
The design shade run reports how much of the park is shaded. The game reports where a walker is in sun. The first real day on a phone took 5:32 with 212 s of it in sun; one leg, splash pad to farm, took 167 s because the 130 m crossing had no cool line at 15:30 and the fatigue floor was set too harsh. Three things followed within a day. The Ehsan station moved in the model from beside the farm to east of the majlis, at (16, 52), splitting the crossing and taking the course to the north of the park for the first time. The walkable mask turned out to be wrong in ways only feet find: the splash pad read as a lattice of walls because the drawing paints its spray as water, and fountain basins were holes with no ground inside — both fixed in the mask builder, both invisible in any area statistic. And a walking-shade study was run along the 522 m loop and the six routes at the six appointment hours, which found the loop’s south edge to be the longest unbroken sunlit run at every hour from 09:30 to 15:30, 65 to 68 m, with the loop only 21% shaded at 14:00.
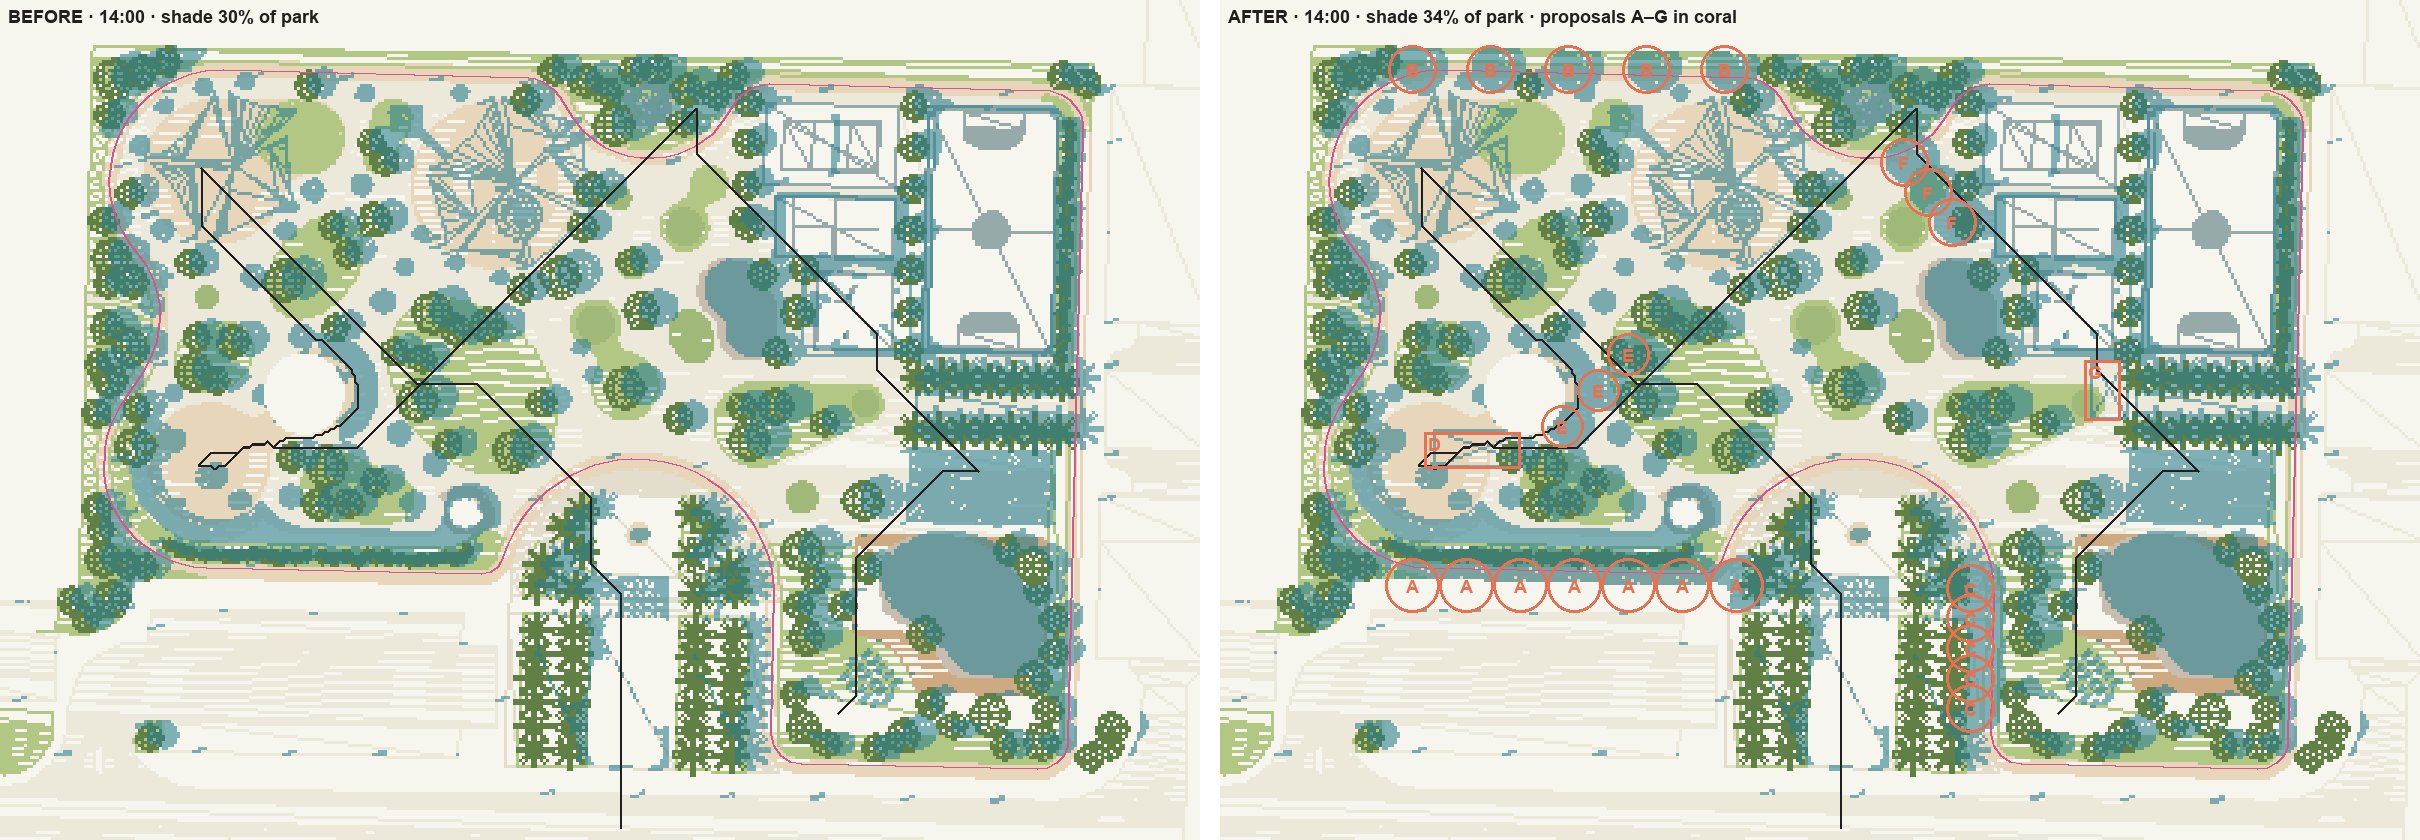
The trees changed
The proposals went to the landscape designer as an issue with coordinates and before/after numbers, and her v4.2 revision of 6 September — trees only — came back the same day. Re-running the masks on that model gives the effect along the lines people walk, which is the measure the game made us look at:
| Along the line, at the leg’s hour | v4.1 (before) | v4.2 (Jiin, 6 Sep) |
|---|---|---|
| Loop, 07:00 — shade share · longest sunlit run | 48% · 55 m | 71% · 15 m |
| Loop, 14:00 | 21% · 68 m | 25% · 65 m |
| Loop, 18:30 | 62% · 50 m | 71% · 11 m |
| Ehsan station → farm, 15:30 | 29% · 29 m | 51% · 7 m |
| Park-wide shade by area, 14:00 | 30.2% | 32.3% |
The morning and evening walkers’ stretch on the loop’s north edge and the afternoon leg past the gym are largely closed. The loop’s south edge at midday, proposal A, is not yet — 65 m of sun remain at 14:00 — and it stays on the record as the next move. The honest caveats stay too: the masks are 0.5 m and six hours, not a full-day sweep; simulated crowns were first drawn at the schedule’s mature size and re-run at the drawn size, which halved the morning gain of one proposal; and the game’s figures are illustrative, excluded from every statistic as before.
The game is not a deliverable and was never a scored one. It is the shade analysis with a thumb on it: the same model, the same sun, the same masks, played instead of read. Playing it moved a station, corrected a mask, produced a walking-shade study and changed the planting within a day — the fastest analysis → decision loop in this report, and the only one a jury member can try on their own phone.
09 — Alternatives
Alternatives considered & rejected
The deliverable explicitly asks what was considered and set aside. Each rejection below is a reasoned choice recorded at the time, not hindsight.
| Considered | Rejected because | Chosen instead |
|---|---|---|
| deck.gl real-time sun shadows | Shadow-acne & picking errors; wouldn’t match the analysis numerically | Pre-computed shadows from the same engine |
| Space-syntax (angular) betweenness | Low discrimination on a homogeneous villa grid | OD-weighted network betweenness |
| High-albedo reflective paving | Model showed it worsens pedestrian comfort | Water-retentive paving in pedestrian zones |
| ETH global canopy height | Misreads buildings as canopy in urban areas | Meta / WRI 1 m canopy |
| Local Gaussian-splat reconstruction | Parallax-limited walk; local build blocked | Hosted capture + orbit re-shoot |
| “Fountain” read from the CAD | It is the Tamtam café, not a fountain (field-verified) | Siting re-framed as a new water feature |
| Online DWG converters | Schedule 6 IP risk | Local LibreDWG conversion |
| LoRa sensor-node mesh (T3-S3 assumption) | Board proved to be a different product — no radio — found by systematic bus probing | AMOLED demonstrator now; sensor mesh deferred to a real-sensor phase |
| Auto-refill (“kind visitor”) in the tree-gochi simulation | Defeats the stewardship mechanic | Soil only refills when a human waters it |
| Thirsty-tree link on the public site | localhost twin is a dead link off the demo machine | Feature gated to locally-served pages |
The reflective-paving and fountain rows show the process working: AI proposed, evidence (or the field) disposed. Several “obvious” moves were killed by the models or by ground-truth before they reached the design.
10 — Decisions
How AI contributed to each decision
The 20% criterion asks how AI contributed to decisions — so this section is the provenance, not the proposal. The design moves themselves live in the Site Analysis report (its “What the AI analysis recommends” list); here we show the model output behind each, so every recommendation is traceable. The clearest case is the intervention matrix, which re-simulated five cooling strategies at 1 m on the 2025-08-01 design day and ranked them by their effect on peak (15:00) comfort:
| # | Scenario | Δ peak UTCI | p95 UTCI | Extreme h/day | Area improved |
|---|---|---|---|---|---|
| 1 | Combined package — trees + retentive paving + mist + reflective roads | −1.27 °C | 52.1 | 6.61 | 45% |
| 2 | 31 new trees (in shade < 2 h zones) | −0.79 | 53.7 | 6.70 | 24% |
| 3 | Water-retentive paving | −0.64 | 52.4 | 6.97 | 30% |
| 4 | Mist (NW, r15 m)* | ±0 | 54.3 | 7.05 | 0.3% |
| 5 | High-albedo paving (α 0.40) | +0.38 (worse) | 55.5 | 7.09 | 0% |
Δ peak UTCI is the 15:00 change vs the do-nothing baseline (negative = cooler); rows ranked best-to-worst. *Mist reads ±0 only because SOLWEIG omits evaporative air cooling — its afternoon benefit is evidenced separately via wet-bulb depression.
The same ranking as a diverging bar. High-albedo paving raises pedestrian heat by reflecting shortwave radiation — the counter-intuitive result that became a design rule.
Each recommendation in the Site Analysis report traces back to a model output the same way — the AI’s contribution is this chain of evidence, not the choice itself:
| Model output (AI) | Decision it informed |
|---|---|
| Reflective paving raises pedestrian UTCI (+0.38 °C) | Reflective surfaces belong on roofs & roads; pedestrian ground stays water-retentive |
| Cluster #113 = 59% of in-park shade | Preserve #113 as the No.1 asset — worth ≈15–20 new saplings |
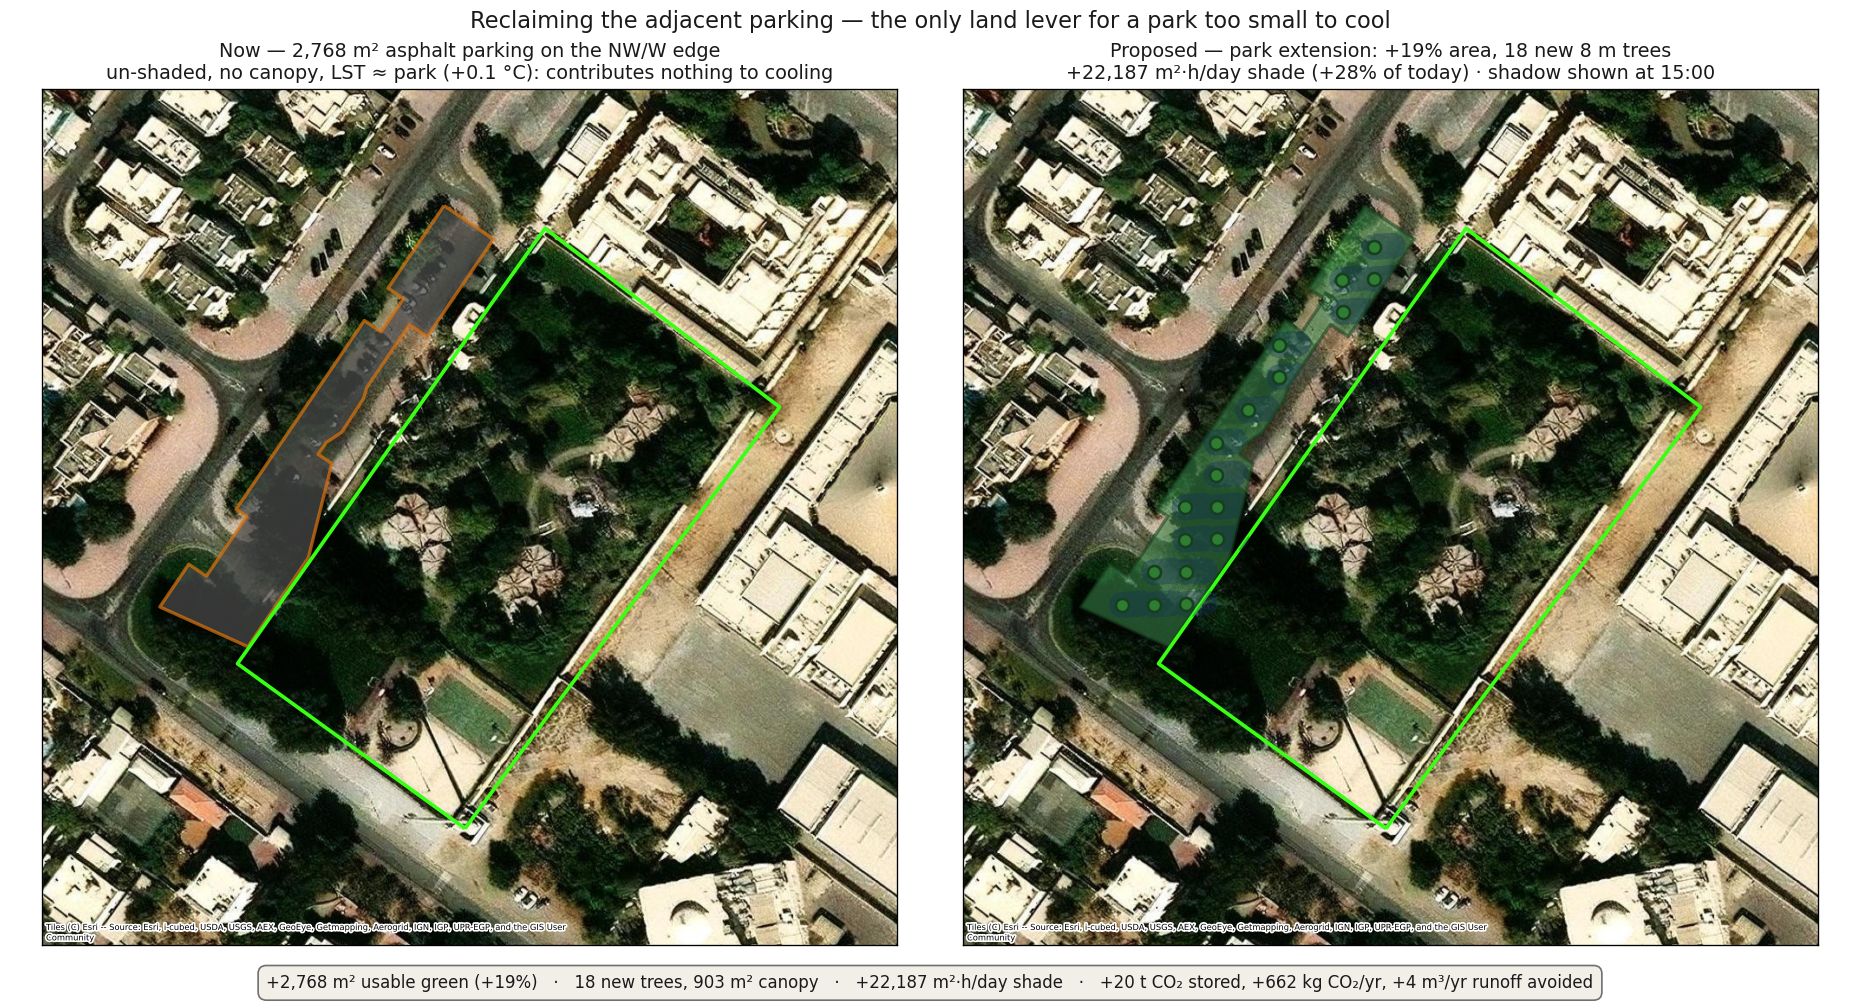
| At 15:00 the coolest route equals the shortest route | The approach street, not the park, is the biggest heat barrier — invest in street trees on the three loaded corridors |
| Best siting cell is NW (upwind, shaded, 0.90) | Place the new water feature NW, not at the downwind east plaza |
| Café’s current east spot is the least-shaded ground in the park (≈1 h/day shade, peak UTCI 53.1 °C, FLIR field p98 46.7 °C) | A site-visit hunch to move the café to the front, refined by the data: relocate to a shaded front spot (palm plaza, ~7 h shade), not the bare entrance |
| Nights are coolest in the open (radiative loss) | Night activation uses open sky + ventilation, not roofed enclosures |
| Review corpus: winter review volume ≈3.5× August, yet only 9/446 texts mention heat | Summer comfort is a suppressed-demand problem — the shade strategy addresses a need residents never wrote down, which no survey-reading would surface |
| Every 2026 one-star review traces to DM-app court bookings refused at the gate | Court access is a governance failure, not a spatial one — make booking state legible at the gate (tech-stays-background), converting the angriest persona back into long-tenured loyalists |
| Most-praised quality across 446 texts is the enclosed, watchable geometry | Protect smallness and sightlines as design constraints — additions that draw crowds threaten the park’s second identity as a quiet refuge |
11 — Limits
Limitations, IP & ethics — stated, not hidden
- Climate transfer is the single largest caveat: borrowed cooling figures are methods, not guaranteed local results.
- Model resolution. ERA5-Land is a single ~9 km point; shade-UTCI approximates radiant temperature as air temperature (optimistic); tree crowns are modelled as opaque (slight over-count); 97.5% of building heights are villa defaults; FLIR shot positions are ±10 m; surface temperature is a morning snapshot, not afternoon comfort.
- Generative-AI IP & originality (Schedule 6): any generative imagery will be geometry-conditioned — “AI constrained by our own simulation” — to avoid hallucinated, unattributable content.
- LLM-persona bias: synthetic residents are a pilot/complement to a real accessibility method, never the sole basis for People-of-Determination provision.
- Review-corpus bias: Google reviewers over-represent English-literate smartphone users comfortable with public profiles; non-reviewing populations (domestic workers, elderly residents, the rehabilitation-hospital community) are invisible in it — field visits cover part of that gap. One review was caught being openly AI-generated (its pasted prompt preamble left in), a reminder to treat fluent individual texts with care. Review volume proxies visitation, it does not measure it. Reviewer names and profile photos are used only in the internal working document, not in public deliverables.
- Tree-gochi sensors are simulated (drift + sine): the demonstrator validates the interaction and display pipeline, not field sensing — the documented swap-in is an I2C temperature/humidity sensor plus a capacitive soil probe. The demo is USB-tethered to the demo machine; both limits resolve with the WiFi step if the idea graduates.
12 — Roadmap
Where the AI process goes next
These directions come from a deep-research technology scan — a pass over the
five still-thin design gaps that maps concrete, mostly open-source tools onto each, paired with a
citable precedent so it doubles as methodology evidence. The scan is
research/tech_scan.md, with a prompt-logged, reproducible re-run — every exact search
query recorded — in research/tech_scan_run.md. Each direction below is broken into a
pick-up-able task — inputs, tool setup, first steps and definition of done — in
NEXT_STEPS.md at the repo root, so a later session or agent can start immediately.
- 1-minute animation (mandatory): no longer a direction — the deterministic animatic is built and the generative method is chosen and validated (see Integrity): MiniMax H3 via fal, conditioned on our own rendered flythrough. Wan and Seedance were tested against it and are recorded there with their failure modes; Wan is not a fallback. Remaining work is production, not method.
- Generative ideation: Wallacei + Ladybug with UTCI as the fitness objective — turning analysis into a design driver (hot-arid Cairo precedent).
- Movement: JuPedSim → PedPy, or a NetLogo shade-seeking ABM over the SOLWEIG grid.
- Community & PoD: the six review-grounded personas (see Coverage) replace generic LLM personas as the base; next steps are synthetic persona portraits (privacy-preserving, demographics from the real avatar corpus), WeDesign-style co-design against them, and a VR accessibility walkthrough.
- Circular: i-Tree Eco + Climate Positive Design Pathfinder for embodied-carbon scoring.
Open gaps to close before submission
anim/refs/ seeded film options B and C but were generated in ChatGPT without the prompt or input images being recorded. This report is scored on provenance chains; it is the one link in the visual chain that cannot currently be shown. Capture it before submission.